Pancreas downstream analysis after DFFP scoring
This notebook is a focused guide to biological analyses performed after the supervised topology, ordering, velocity graph, anchor diagnostics, and Discounted Future-Fate Propagation (DFFP) model have been accepted.
It distinguishes three questions:
Which genes are expressed along the fitted trajectory?
Which genes are associated with variation in a DFFP outcome?
Which genes mark annotated terminal identities versus the root?
These are descriptive or associative analyses. They do not by themselves establish causal lineage drivers.
Execution provenance. The displayed outputs were generated with scCS 0.8.0.dev33. Version 0.8.0.dev34 changes documentation and tutorial explanation only; the scientific calculations are unchanged.
1. Installation, versions, and reproducibility
[1]:
from __future__ import annotations
import warnings

from pathlib import Path
import importlib.metadata as importlib_metadata
import platform
import sys

import matplotlib.pyplot as plt
import numpy as np
import pandas as pd
import scanpy as sc
import scvelo as scv
from scipy.spatial.distance import jensenshannon

import scCS

SEED = 20260714
N_JOBS = 1
sc.settings.verbosity = 2
scv.settings.verbosity = 2
sc.set_figure_params(dpi=100, facecolor="white")

print("Python", sys.version.split()[0])
print("Platform", platform.platform())
print("scCS", scCS.__version__)
print("Scanpy", importlib_metadata.version("scanpy"))
print("scVelo", scv.__version__)

OUTPUT_DIR = Path("tutorial_outputs/pancreas_downstream")
OUTPUT_DIR.mkdir(parents=True, exist_ok=True)

# Hide known warnings emitted by optional upstream dependencies. These do not
# change the scCS calculation and would otherwise distract from the tutorial.
warnings.filterwarnings(
    "ignore",
    message=r"This process .* is multi-threaded, use of fork\(\) may lead to deadlocks.*",
    category=DeprecationWarning,
)
warnings.filterwarnings(
    "ignore",
    category=DeprecationWarning,
    module=r"cellrank\..*",
)
Python 3.12.13
Platform Linux-6.6.114.1-microsoft-standard-WSL2-x86_64-with-glibc2.39
scCS 0.8.0.dev33
Scanpy 1.11.5
scVelo 0.3.4
2. Load pancreas and fit dynamical RNA velocity
Neighbors, moments, kinetic fitting, velocity, and the velocity graph are computed in the original PCA/expression manifold. The supervised star is not used to create neighborhoods or refit velocity.
This tutorial deliberately starts from the public dataset and recomputes the velocity model. No pre-existing scCS cache is assumed. Dynamical fitting can take several minutes, but showing the complete preparation makes every analysis step reproducible for a first-time user.
[2]:
def clear_velocity_outputs(adata, *, clear_dynamics=False):
    """Remove stale velocity fields before fitting a requested model."""
    for key in ("velocity", "velocity_u", "velocity_variance"):
        adata.layers.pop(key, None)
    for key in ("velocity_graph", "velocity_graph_neg", "velocity_params"):
        adata.uns.pop(key, None)
    for key in (
        "velocity_self_transition",
        "root_cells",
        "end_points",
        "velocity_pseudotime",
        "latent_time",
    ):
        if key in adata.obs:
            del adata.obs[key]
    if clear_dynamics:
        for key in list(adata.var.columns):
            if str(key).startswith("fit_"):
                del adata.var[key]
        for key in list(adata.layers):
            if str(key).startswith("fit_"):
                del adata.layers[key]
        adata.uns.pop("recover_dynamics", None)


def ensure_pca_neighbors_moments(
    adata,
    *,
    n_pcs=30,
    n_neighbors=30,
    preserve_existing_neighbors=False,
):
    """Create the unbiased PCA neighbor graph used by RNA velocity."""
    if "X_pca" not in adata.obsm:
        n_comps = min(n_pcs, adata.n_obs - 1, adata.n_vars - 1)
        sc.pp.pca(adata, n_comps=n_comps)
    if "neighbors" not in adata.uns or not preserve_existing_neighbors:
        sc.pp.neighbors(
            adata,
            n_neighbors=min(n_neighbors, adata.n_obs - 1),
            n_pcs=min(n_pcs, adata.obsm["X_pca"].shape[1]),
            use_rep="X_pca",
            random_state=SEED,
        )
    if not {"Ms", "Mu"}.issubset(adata.layers):
        scv.pp.moments(adata, n_neighbors=None, n_pcs=None)
    if "X_umap" not in adata.obsm:
        sc.tl.umap(adata, random_state=SEED)


def resolve_present_genes(adata, candidates):
    """Resolve gene symbols case-insensitively and report missing markers."""
    lookup = {str(gene).lower(): str(gene) for gene in adata.var_names}
    resolved, missing = [], []
    for candidate in candidates:
        match = lookup.get(str(candidate).lower())
        if match is None:
            missing.append(str(candidate))
        elif match not in resolved:
            resolved.append(match)
    return resolved, missing


def row_js(left, right):
    """Row-wise Jensen-Shannon divergence with base-2 logarithms."""
    return np.asarray(
        [jensenshannon(a, b, base=2.0) ** 2 for a, b in zip(left, right)],
        dtype=float,
    )


def ordering_thirds(values):
    """Return stable early/middle/late labels for a continuous coordinate."""
    series = pd.Series(np.asarray(values, dtype=float))
    ranked = series.rank(method="first")
    return (
        pd.qcut(
            ranked,
            q=3,
            labels=["early", "middle", "late"],
            duplicates="drop",
        )
        .astype(str)
        .to_numpy()
    )
[3]:
RECOVER_DYNAMICS_MAX_ITER = 20

# Load the public scVelo pancreas dataset.
adata = scv.datasets.pancreas()
adata.var_names_make_unique()

# Fit RNA velocity in the original expression/PCA manifold.
scv.pp.filter_and_normalize(adata, min_shared_counts=20)
ensure_pca_neighbors_moments(
    adata,
    n_pcs=30,
    n_neighbors=30,
    preserve_existing_neighbors=False,
)
clear_velocity_outputs(adata, clear_dynamics=True)

# Dynamical velocity is used because the pancreas dataset contains several
# kinetic regimes and non-monotonic terminal trajectories.
scv.tl.recover_dynamics(
    adata,
    max_iter=RECOVER_DYNAMICS_MAX_ITER,
    n_jobs=N_JOBS,
)
scv.tl.velocity(adata, mode="dynamical")
scv.tl.velocity_graph(adata, n_jobs=N_JOBS)
scv.tl.terminal_states(adata)
scv.tl.latent_time(
    adata,
    vkey="velocity",
    root_key="root_cells",
    end_key="end_points",
)
scv.tl.velocity_pseudotime(adata, vkey="velocity")

print(adata)
display(adata.obs["clusters"].astype(str).value_counts().to_frame("n_cells"))
Filtered out 20801 genes that are detected 20 counts (shared).
Normalized count data: X, spliced, unspliced.
computing neighbors
    finished (0:00:13)
computing moments based on connectivities
    finished (0:00:03)
recovering dynamics (using 1/24 cores)
/home/emil/miniforge3/envs/lab-py312/lib/python3.12/multiprocessing/popen_fork.py:66: DeprecationWarning: This process (pid=93037) is multi-threaded, use of fork() may lead to deadlocks in the child.
  self.pid = os.fork()
    finished (0:26:34)
computing velocities
    finished (0:00:09)
computing velocity graph (using 1/24 cores)
/home/emil/miniforge3/envs/lab-py312/lib/python3.12/multiprocessing/popen_fork.py:66: DeprecationWarning: This process (pid=93037) is multi-threaded, use of fork() may lead to deadlocks in the child.
  self.pid = os.fork()
    finished (0:00:14)
computing terminal states
    identified 2 regions of root cells and 1 region of end points .
    finished (0:00:00)
computing latent time using root_cells, end_points as prior
    finished (0:00:03)
AnnData object with n_obs × n_vars = 3696 × 7197
    obs: 'clusters_coarse', 'clusters', 'S_score', 'G2M_score', 'initial_size_unspliced', 'initial_size_spliced', 'initial_size', 'n_counts', 'velocity_self_transition', 'root_cells', 'end_points', 'velocity_pseudotime', 'latent_time'
    var: 'highly_variable_genes', 'gene_count_corr', 'fit_r2', 'fit_alpha', 'fit_beta', 'fit_gamma', 'fit_t_', 'fit_scaling', 'fit_std_u', 'fit_std_s', 'fit_likelihood', 'fit_u0', 'fit_s0', 'fit_pval_steady', 'fit_steady_u', 'fit_steady_s', 'fit_variance', 'fit_alignment_scaling', 'velocity_genes'
    uns: 'clusters_coarse_colors', 'clusters_colors', 'day_colors', 'neighbors', 'pca', 'recover_dynamics', 'velocity_params', 'velocity_graph', 'velocity_graph_neg'
    obsm: 'X_pca', 'X_umap'
    varm: 'loss'
    layers: 'spliced', 'unspliced', 'Ms', 'Mu', 'fit_t', 'fit_tau', 'fit_tau_', 'velocity', 'velocity_u'
    obsp: 'distances', 'connectivities'
| n_cells | |
|---|---|
| clusters | |
| Ductal | 916 |
| Ngn3 high EP | 642 |
| Pre-endocrine | 592 |
| Beta | 591 |
| Alpha | 481 |
| Ngn3 low EP | 262 |
| Epsilon | 142 |
| Delta | 70 |
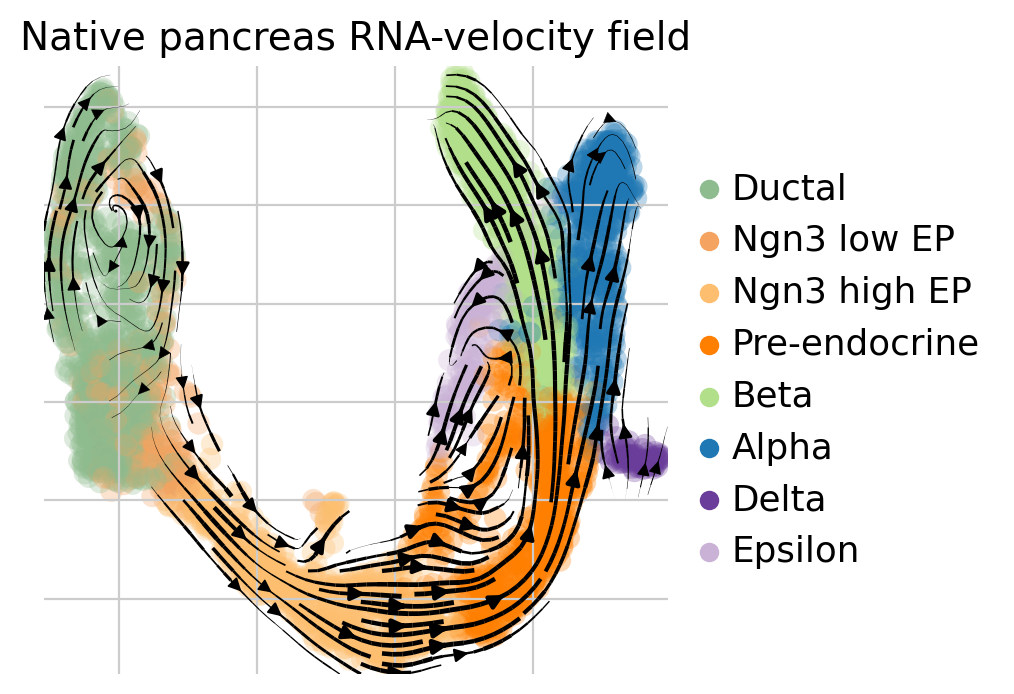
3. Inspect native annotations, ordering candidates, and the velocity field
[4]:
selected_labels = [
    "Ngn3 high EP",
    "Pre-endocrine",
    "Alpha",
    "Beta",
    "Delta",
    "Epsilon",
]
selected_mask_full = adata.obs["clusters"].astype(str).isin(selected_labels)
ordering_columns = [key for key in ("latent_time", "velocity_pseudotime") if key in adata.obs]
display(
    adata.obs.loc[selected_mask_full, ["clusters", *ordering_columns]]
    .groupby("clusters", observed=True)
    .agg(["count", "median", "min", "max"])
)

scv.pl.velocity_embedding_stream(
    adata,
    basis="umap",
    color="clusters",
    legend_loc="right margin",
    title="Native pancreas RNA-velocity field",
)
| latent_time | velocity_pseudotime | |||||||
|---|---|---|---|---|---|---|---|---|
| count | median | min | max | count | median | min | max | |
| clusters | ||||||||
| Ngn3 high EP | 642 | 0.538150 | 0.197135 | 0.668318 | 642 | 0.439079 | 0.116273 | 0.632564 |
| Pre-endocrine | 592 | 0.719086 | 0.544826 | 0.767974 | 592 | 0.814839 | 0.497939 | 0.914136 |
| Beta | 591 | 0.728306 | 0.690814 | 1.000000 | 591 | 0.883505 | 0.835416 | 1.000000 |
| Alpha | 481 | 0.745250 | 0.704222 | 0.797031 | 481 | 0.909996 | 0.830502 | 0.920302 |
| Delta | 70 | 0.785738 | 0.693870 | 0.841107 | 70 | 0.918165 | 0.904303 | 0.926678 |
| Epsilon | 142 | 0.740098 | 0.697535 | 0.758869 | 142 | 0.908112 | 0.863491 | 0.913667 |
computing velocity embedding
    finished (0:00:00)
4. Define the supervised furcation and run preflight diagnostics
The incoming path contains both Ngn3 high EP and Pre-endocrine because the earlier progenitor state is required to represent the complete approach to the endocrine furcation. Dynamical latent time is used for the scientific ordering.
[5]:
ROOT = ("Ngn3 high EP", "Pre-endocrine")
FATES = ["Alpha", "Beta", "Delta", "Epsilon"]
ORDERING_KEY = "latent_time"

scorer = scCS.SingleScorer(
    adata,
    root=ROOT,
    branches=FATES,
    obs_key="clusters",
)
preflight = scorer.preflight(ordering_metric=ORDERING_KEY, check_velocity=True)
preflight.display()
preflight.raise_for_errors()

scorer.build_embedding(
    ordering_metric=ORDERING_KEY,
    write_to_adata=True,
)
| level | code | message | value | |
|---|---|---|---|---|
| 0 | info | furcation_valid | Root and terminal annotations are valid. | 2518.0 |
| 1 | info | root_cells | Root population contains 1234 cells. | 1234.0 |
| 2 | info | terminal_Alpha | Terminal 'Alpha' contains 481 cells. | 481.0 |
| 3 | info | terminal_Beta | Terminal 'Beta' contains 591 cells. | 591.0 |
| 4 | info | terminal_Delta | Terminal 'Delta' contains 70 cells. | 70.0 |
| 5 | info | terminal_Epsilon | Terminal 'Epsilon' contains 142 cells. | 142.0 |
| 6 | info | ordering_valid | Ordering metric is finite and non-constant amo... | 1.0 |
| 7 | info | ordering_resolution | Root ordering has 1234 unique values across 12... | 1.0 |
| 8 | info | velocity_available | Velocity information is available. | NaN |
[scCS] Scientific star built for 2518 cells in 4 dimensions.
       Root radial clipping: 0.050 low / 0.050 high
       Terminal scientific coordinates: fixed equal-radius simplex vertices (radius=1.000).
[5]:
<scCS.single.SingleScorer at 0x7e0efe20a720>
5. Fit the primary discounted future-fate model
[6]:
FUTURE_OPTIONS = {
    "effective_horizon": 64,
    "anchor_quantile": 0.90,
    "min_anchor_cells": 10,
    "progression_scale": "rank",
    "committed_reach_threshold": 0.25,
    "committed_specificity_threshold": 0.25,
}

scorer.fit(
    scoring_mode="future_fate",
    future_fate_options=FUTURE_OPTIONS,
)
result = scorer.score(write_to_adata=True)

display(pd.Series(result.summary(), name="value").to_frame())
anchor_diagnostics = result.anchor_diagnostics_frame()
display(anchor_diagnostics)
anchor_diagnostics.to_csv(OUTPUT_DIR / "anchor_diagnostics.csv", index=False)
scCS FutureFateScoreResult
  Furcation: root -> ['Alpha', 'Beta', 'Delta', 'Epsilon']
  Effective horizon: 64 (gamma=0.984615)
  Cells: 2518 selected; 1234 root
  Root affinity coverage: 1.000
  Root mean future-fate reach: 0.624
  Root mean future-fate entropy: 0.597
  Root mean future-fate specificity: 0.403
  Root mean reach-supported specificity: 0.254
  Root mean unresolved probability: 0.376
  Root mean signed progression: 0.041
  Root future-fate composition: Alpha=0.291, Beta=0.630, Delta=0.000, Epsilon=0.079
  Solver: direct; iterations=1; residual=1.927e-15
scCS FutureFateScoreResult
  Furcation: root -> ['Alpha', 'Beta', 'Delta', 'Epsilon']
  Effective horizon: 64 (gamma=0.984615)
  Cells: 2518 selected; 1234 root
  Root affinity coverage: 1.000
  Root mean future-fate reach: 0.624
  Root mean future-fate entropy: 0.597
  Root mean future-fate specificity: 0.403
  Root mean reach-supported specificity: 0.254
  Root mean unresolved probability: 0.376
  Root mean signed progression: 0.041
  Root future-fate composition: Alpha=0.291, Beta=0.630, Delta=0.000, Epsilon=0.079
  Solver: direct; iterations=1; residual=1.927e-15
| value | |
|---|---|
| 0 | scCS FutureFateScoreResult\n Furcation: root ... |
| fate | n_anchors | mean_transition_to_same_fate_population | mean_transition_to_root | mean_transition_to_other_selected_fates | mean_transition_outside_selected_path | mean_signed_progression | forward_fraction | |
|---|---|---|---|---|---|---|---|---|
| 0 | Alpha | 49 | 0.998604 | 0.000101 | 0.001295 | 0.0 | -0.039809 | 0.000000 |
| 1 | Beta | 60 | 1.000000 | 0.000000 | 0.000000 | 0.0 | -0.009623 | 0.033333 |
| 2 | Delta | 10 | 0.857701 | 0.000722 | 0.141577 | 0.0 | -0.042991 | 0.000000 |
| 3 | Epsilon | 15 | 0.686047 | 0.198733 | 0.115220 | 0.0 | -0.098604 | 0.000000 |
6. Downstream-analysis checklist
Before screening genes, verify that the primary result is numerically stable and biologically interpretable. The table below records the key DFFP quantities and anchor diagnostics that should accompany every downstream analysis.
[7]:
summary_table = pd.DataFrame(
    {
        "cell_id": result.cell_ids,
        "population": np.where(
            result.root_mask,
            "root",
            result.embedding.terminal_names.astype(str),
        ),
        "DFR": result.discounted_fate_reach,
        "FFS": result.future_fate_specificity,
        "RC": result.resolved_commitment,
        "UFP": result.unresolved_future_probability,
        "SOF": result.signed_ordering_flux,
    }
)
for fate_index, fate in enumerate(result.fate_names):
    summary_table[f"CFA:{fate}"] = result.conditional_fate_affinity[:, fate_index]
display(summary_table.describe(include="all").T)
display(result.anchor_diagnostics_frame())
| count | unique | top | freq | mean | std | min | 25% | 50% | 75% | max | |
|---|---|---|---|---|---|---|---|---|---|---|---|
| cell_id | 2518 | 2518 | AAACCTGAGAGGGATA | 1 | NaN | NaN | NaN | NaN | NaN | NaN | NaN |
| population | 2518 | 5 | root | 1234 | NaN | NaN | NaN | NaN | NaN | NaN | NaN |
| DFR | 2518.0 | NaN | NaN | NaN | 0.681311 | 0.120331 | 0.207807 | 0.610795 | 0.646416 | 0.757218 | 1.0 |
| FFS | 2518.0 | NaN | NaN | NaN | 0.573098 | 0.258765 | 0.202401 | 0.388979 | 0.402197 | 0.795657 | 1.0 |
| RC | 2518.0 | NaN | NaN | NaN | 0.415288 | 0.260153 | 0.121476 | 0.235194 | 0.258604 | 0.575375 | 1.0 |
| UFP | 2518.0 | NaN | NaN | NaN | 0.318689 | 0.120331 | 0.0 | 0.242782 | 0.353584 | 0.389205 | 0.792193 |
| SOF | 2518.0 | NaN | NaN | NaN | 0.040804 | 0.109793 | -0.333231 | -0.00598 | 0.023918 | 0.083306 | 0.516719 |
| CFA:Alpha | 2518.0 | NaN | NaN | NaN | 0.302031 | 0.267297 | 0.0 | 0.088344 | 0.305749 | 0.311221 | 1.0 |
| CFA:Beta | 2518.0 | NaN | NaN | NaN | 0.591167 | 0.309288 | 0.0 | 0.41709 | 0.622889 | 0.82202 | 1.0 |
| CFA:Delta | 2518.0 | NaN | NaN | NaN | 0.005288 | 0.063794 | 0.0 | 0.000044 | 0.000214 | 0.000223 | 1.0 |
| CFA:Epsilon | 2518.0 | NaN | NaN | NaN | 0.101514 | 0.175265 | 0.0 | 0.015142 | 0.070764 | 0.072405 | 1.0 |
| fate | n_anchors | mean_transition_to_same_fate_population | mean_transition_to_root | mean_transition_to_other_selected_fates | mean_transition_outside_selected_path | mean_signed_progression | forward_fraction | |
|---|---|---|---|---|---|---|---|---|
| 0 | Alpha | 49 | 0.998604 | 0.000101 | 0.001295 | 0.0 | -0.039809 | 0.000000 |
| 1 | Beta | 60 | 1.000000 | 0.000000 | 0.000000 | 0.0 | -0.009623 | 0.033333 |
| 2 | Delta | 10 | 0.857701 | 0.000722 | 0.141577 | 0.0 | -0.042991 | 0.000000 |
| 3 | Epsilon | 15 | 0.686047 | 0.198733 | 0.115220 | 0.0 | -0.098604 | 0.000000 |
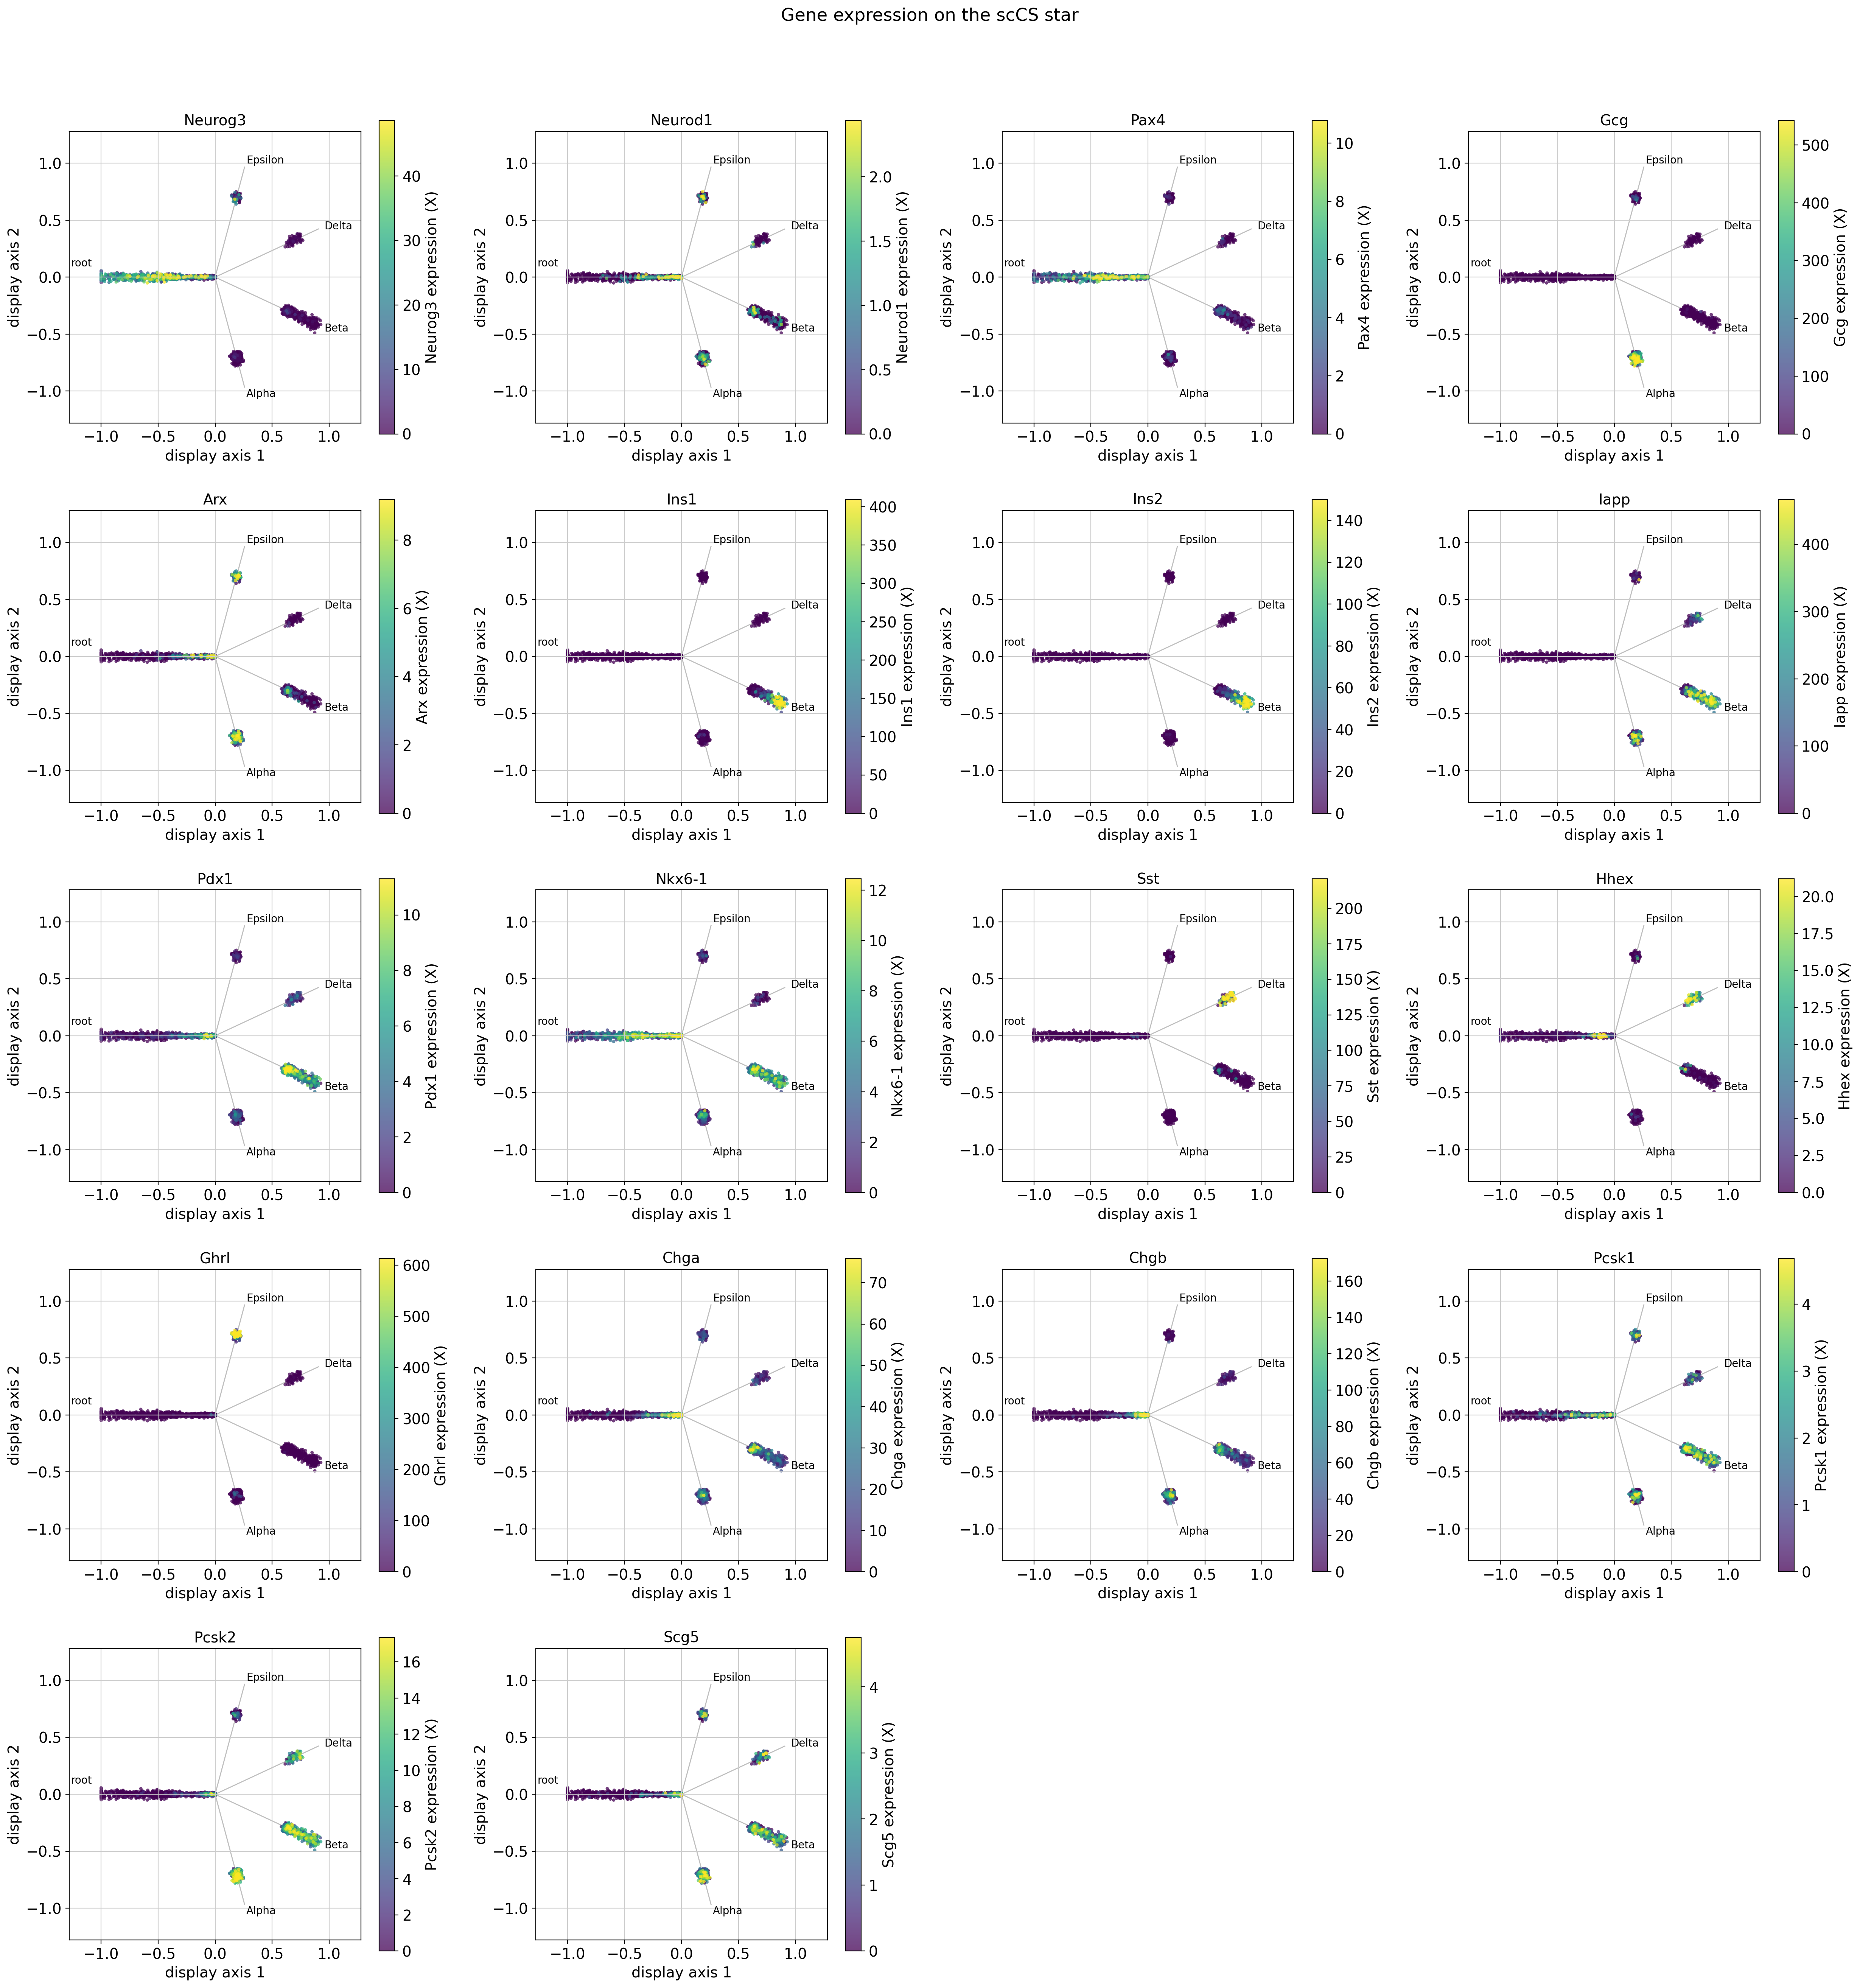
7. Resolve and visualize known biological markers
Gene symbols are resolved case-insensitively because public datasets can use mouse-style capitalization. Missing genes are reported rather than silently ignored.
[8]:
marker_candidates = {
    "progenitor": ["Neurog3", "Neurod1", "Insm1", "Pax4"],
    "Alpha": ["Gcg", "Mafb", "Arx"],
    "Beta": ["Ins1", "Ins2", "Iapp", "Pdx1", "Nkx6-1", "Mafa"],
    "Delta": ["Sst", "Hhex"],
    "Epsilon": ["Ghrl"],
    "secretory": ["Chga", "Chgb", "Pcsk1", "Pcsk2", "Scg5"],
}
resolved_groups = {}
missing_groups = {}
for group, candidates in marker_candidates.items():
    resolved, missing = resolve_present_genes(adata, candidates)
    resolved_groups[group] = resolved
    missing_groups[group] = missing

display(
    pd.DataFrame(
        {
            "resolved": {key: ", ".join(value) for key, value in resolved_groups.items()},
            "missing": {key: ", ".join(value) for key, value in missing_groups.items()},
        }
    )
)
markers = list(dict.fromkeys(gene for genes in resolved_groups.values() for gene in genes))
| resolved | missing | |
|---|---|---|
| progenitor | Neurog3, Neurod1, Pax4 | Insm1 |
| Alpha | Gcg, Arx | Mafb |
| Beta | Ins1, Ins2, Iapp, Pdx1, Nkx6-1 | Mafa |
| Delta | Sst, Hhex | |
| Epsilon | Ghrl | |
| secretory | Chga, Chgb, Pcsk1, Pcsk2, Scg5 |
[9]:
marker_figure = scorer.plot_gene_expression_star(
    markers,
    result,
    ncols=4,
    shared_scale=False,
    terminal_layout="ordering",
)
marker_figure.savefig(
    OUTPUT_DIR / "downstream_marker_expression_stars.png",
    dpi=200,
    bbox_inches="tight",
)
plt.show()
8. Expression trends along ordering and DFFP quantities
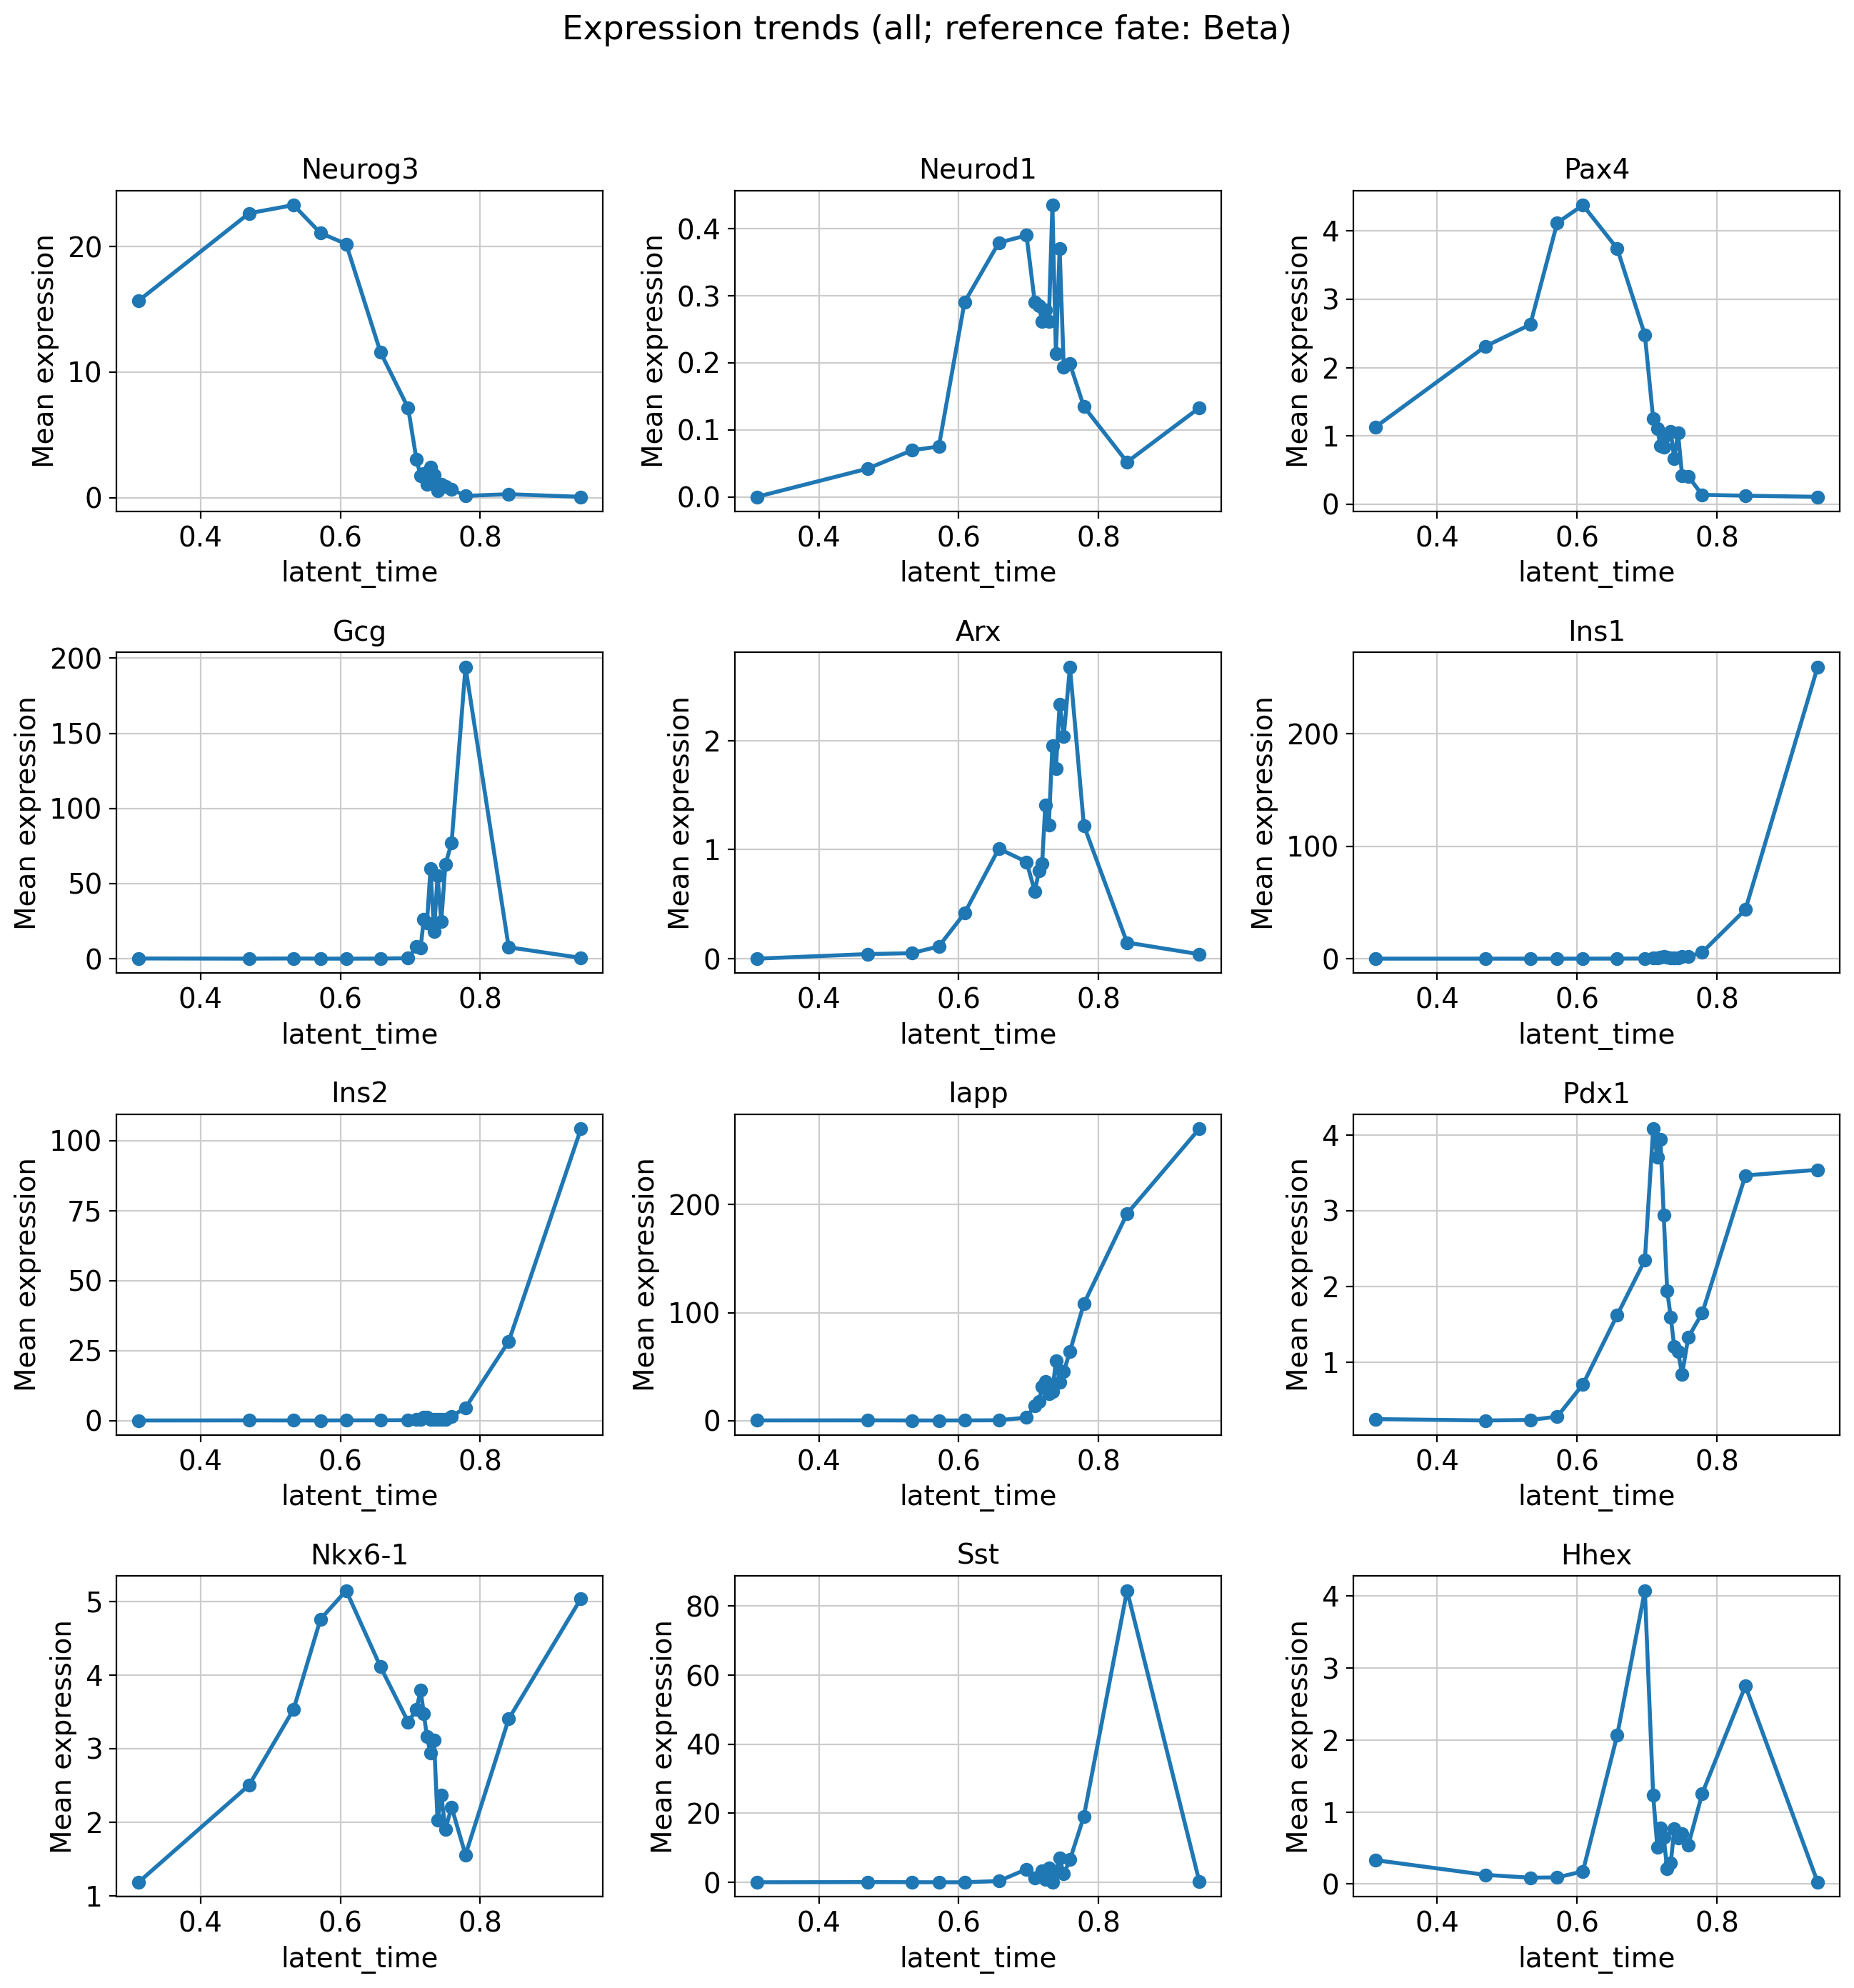
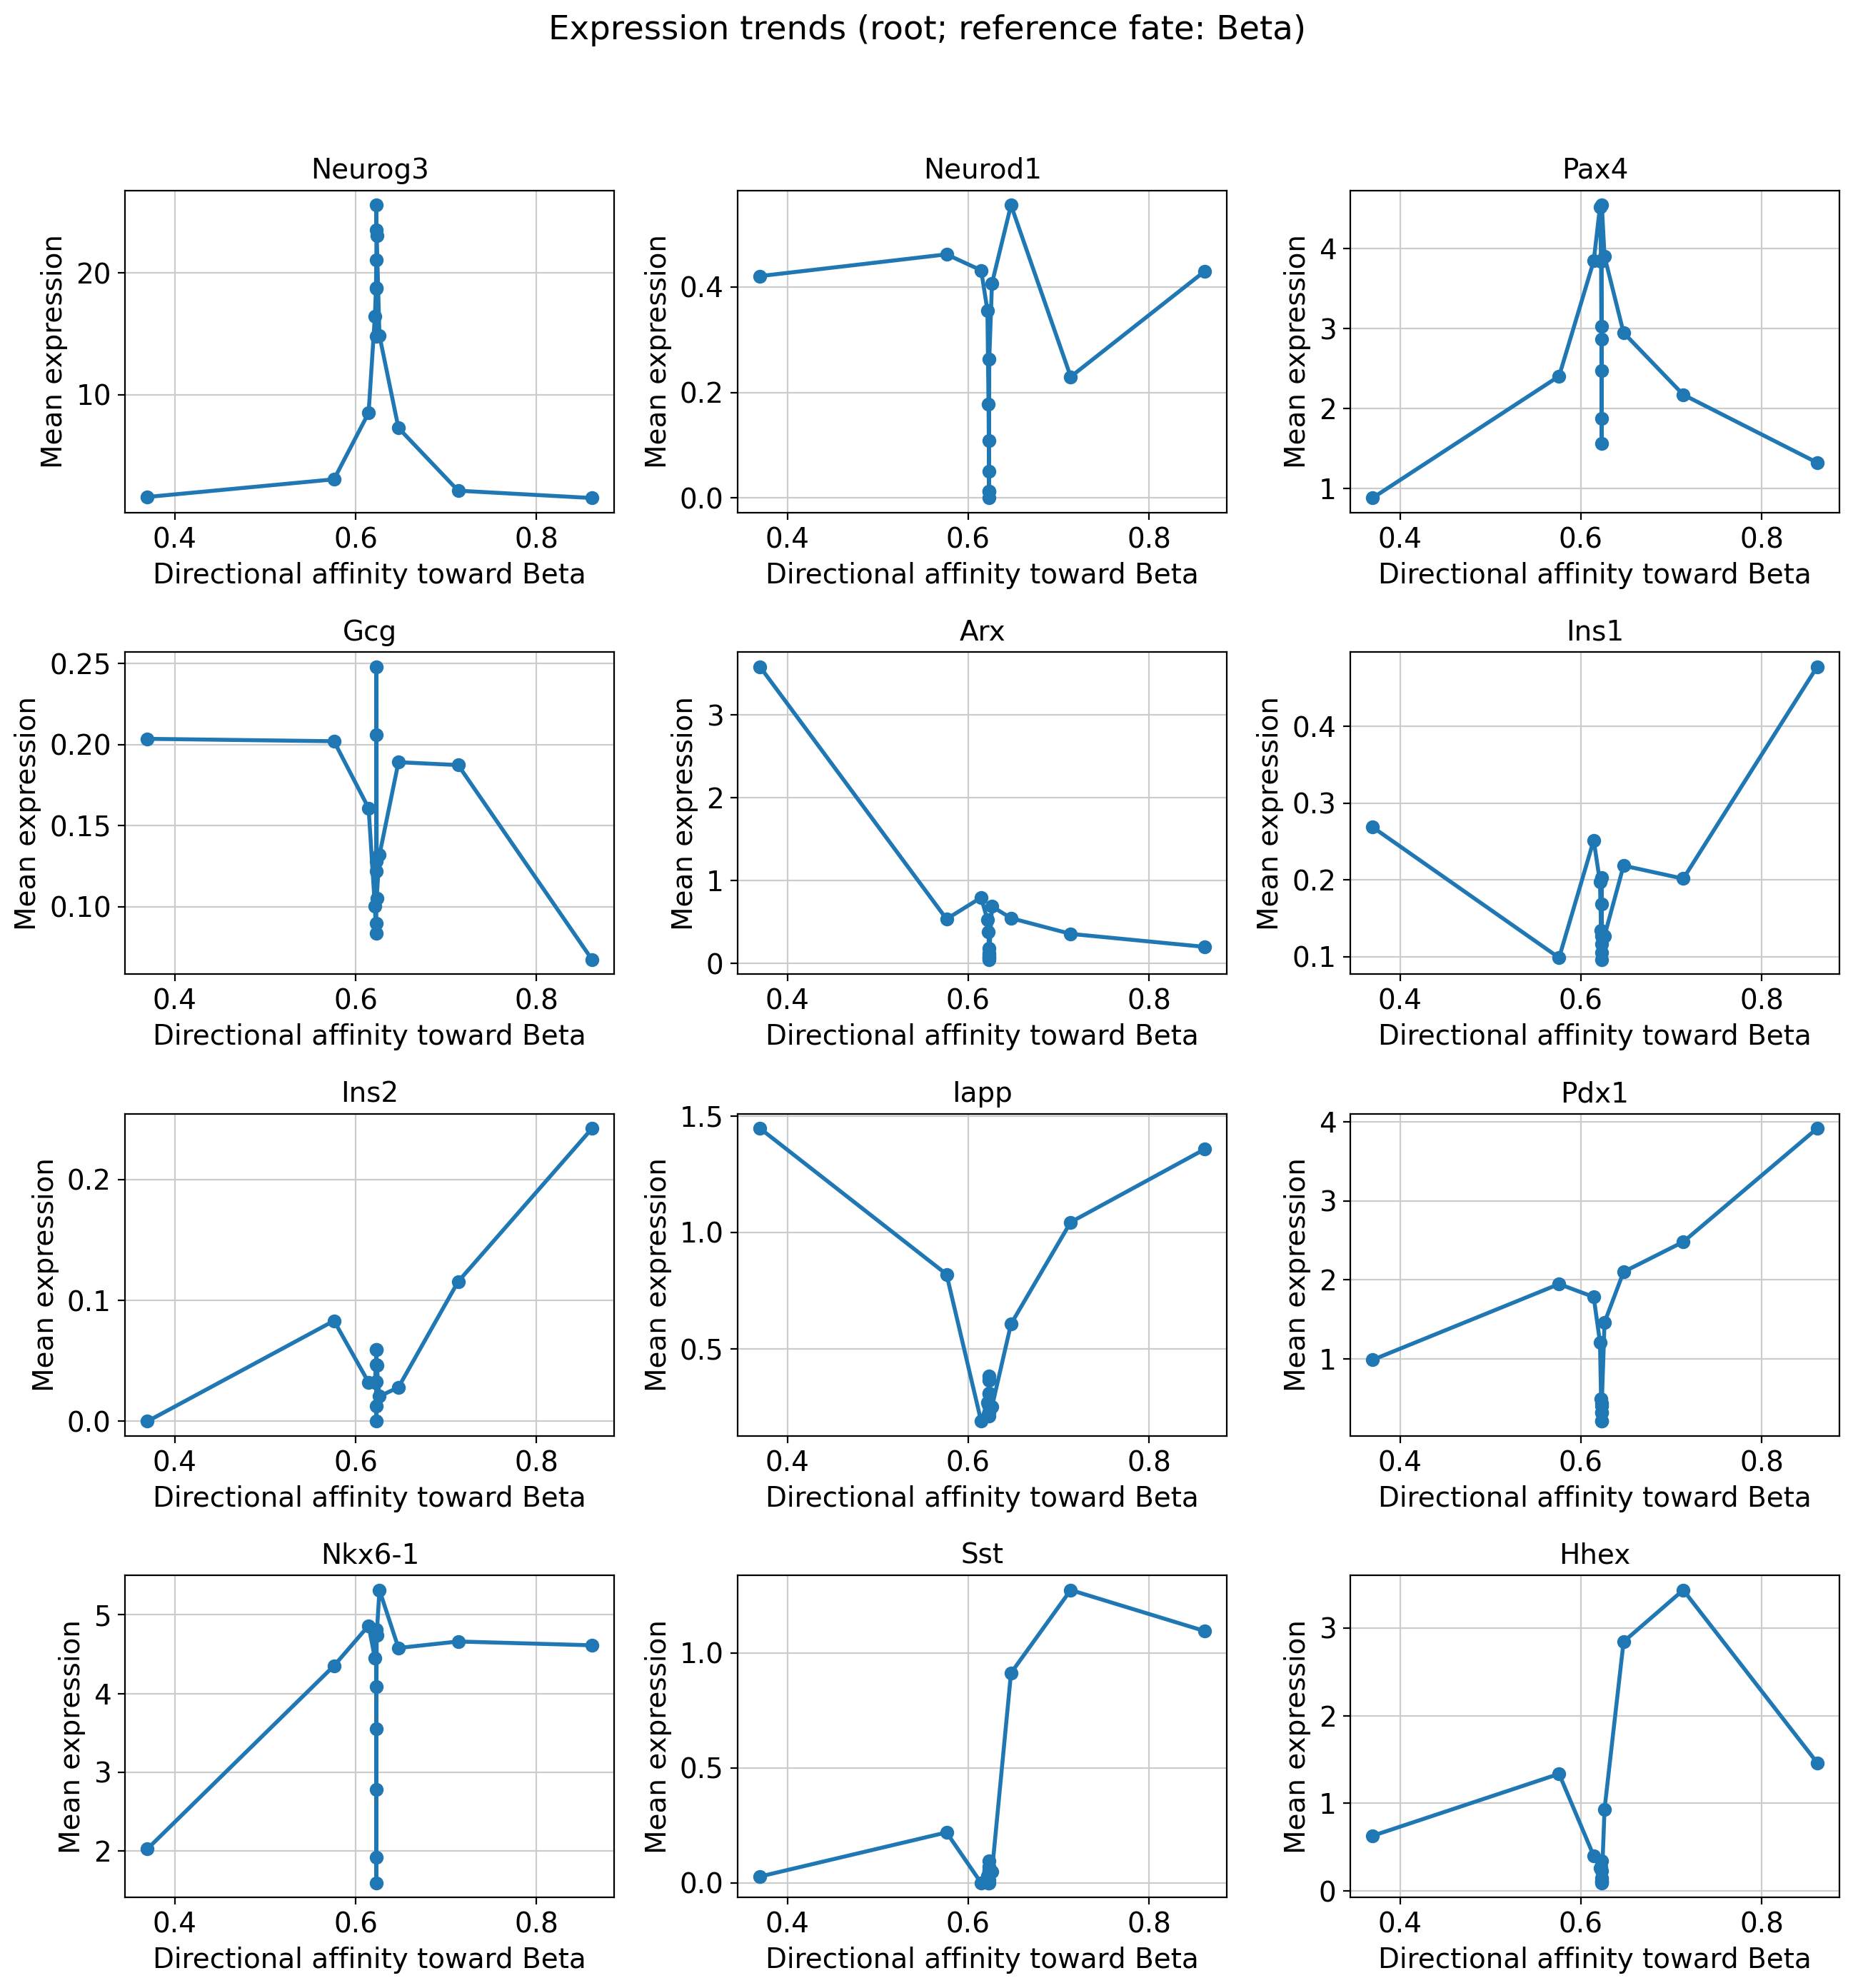
Ordering trends show when a gene changes along the selected developmental coordinate. CFA and RC trends instead ask whether expression covaries with a specific future identity or with resolved commitment.
[10]:
trend_genes = markers[:12]
ordering_trends = scorer.plot_expression_trends(
    trend_genes,
    result,
    x_axis="ordering",
    population="all",
    n_bins=20,
    ncols=3,
)
ordering_trends.savefig(
    OUTPUT_DIR / "expression_trends_ordering.png",
    dpi=200,
    bbox_inches="tight",
)
plt.show()

beta_trends = scorer.plot_expression_trends(
    trend_genes,
    result,
    fate="Beta",
    x_axis="affinity",
    population="root",
    n_bins=15,
    ncols=3,
)
beta_trends.savefig(
    OUTPUT_DIR / "expression_trends_beta_CFA.png",
    dpi=200,
    bbox_inches="tight",
)
plt.show()
9. Candidate commitment-associated genes
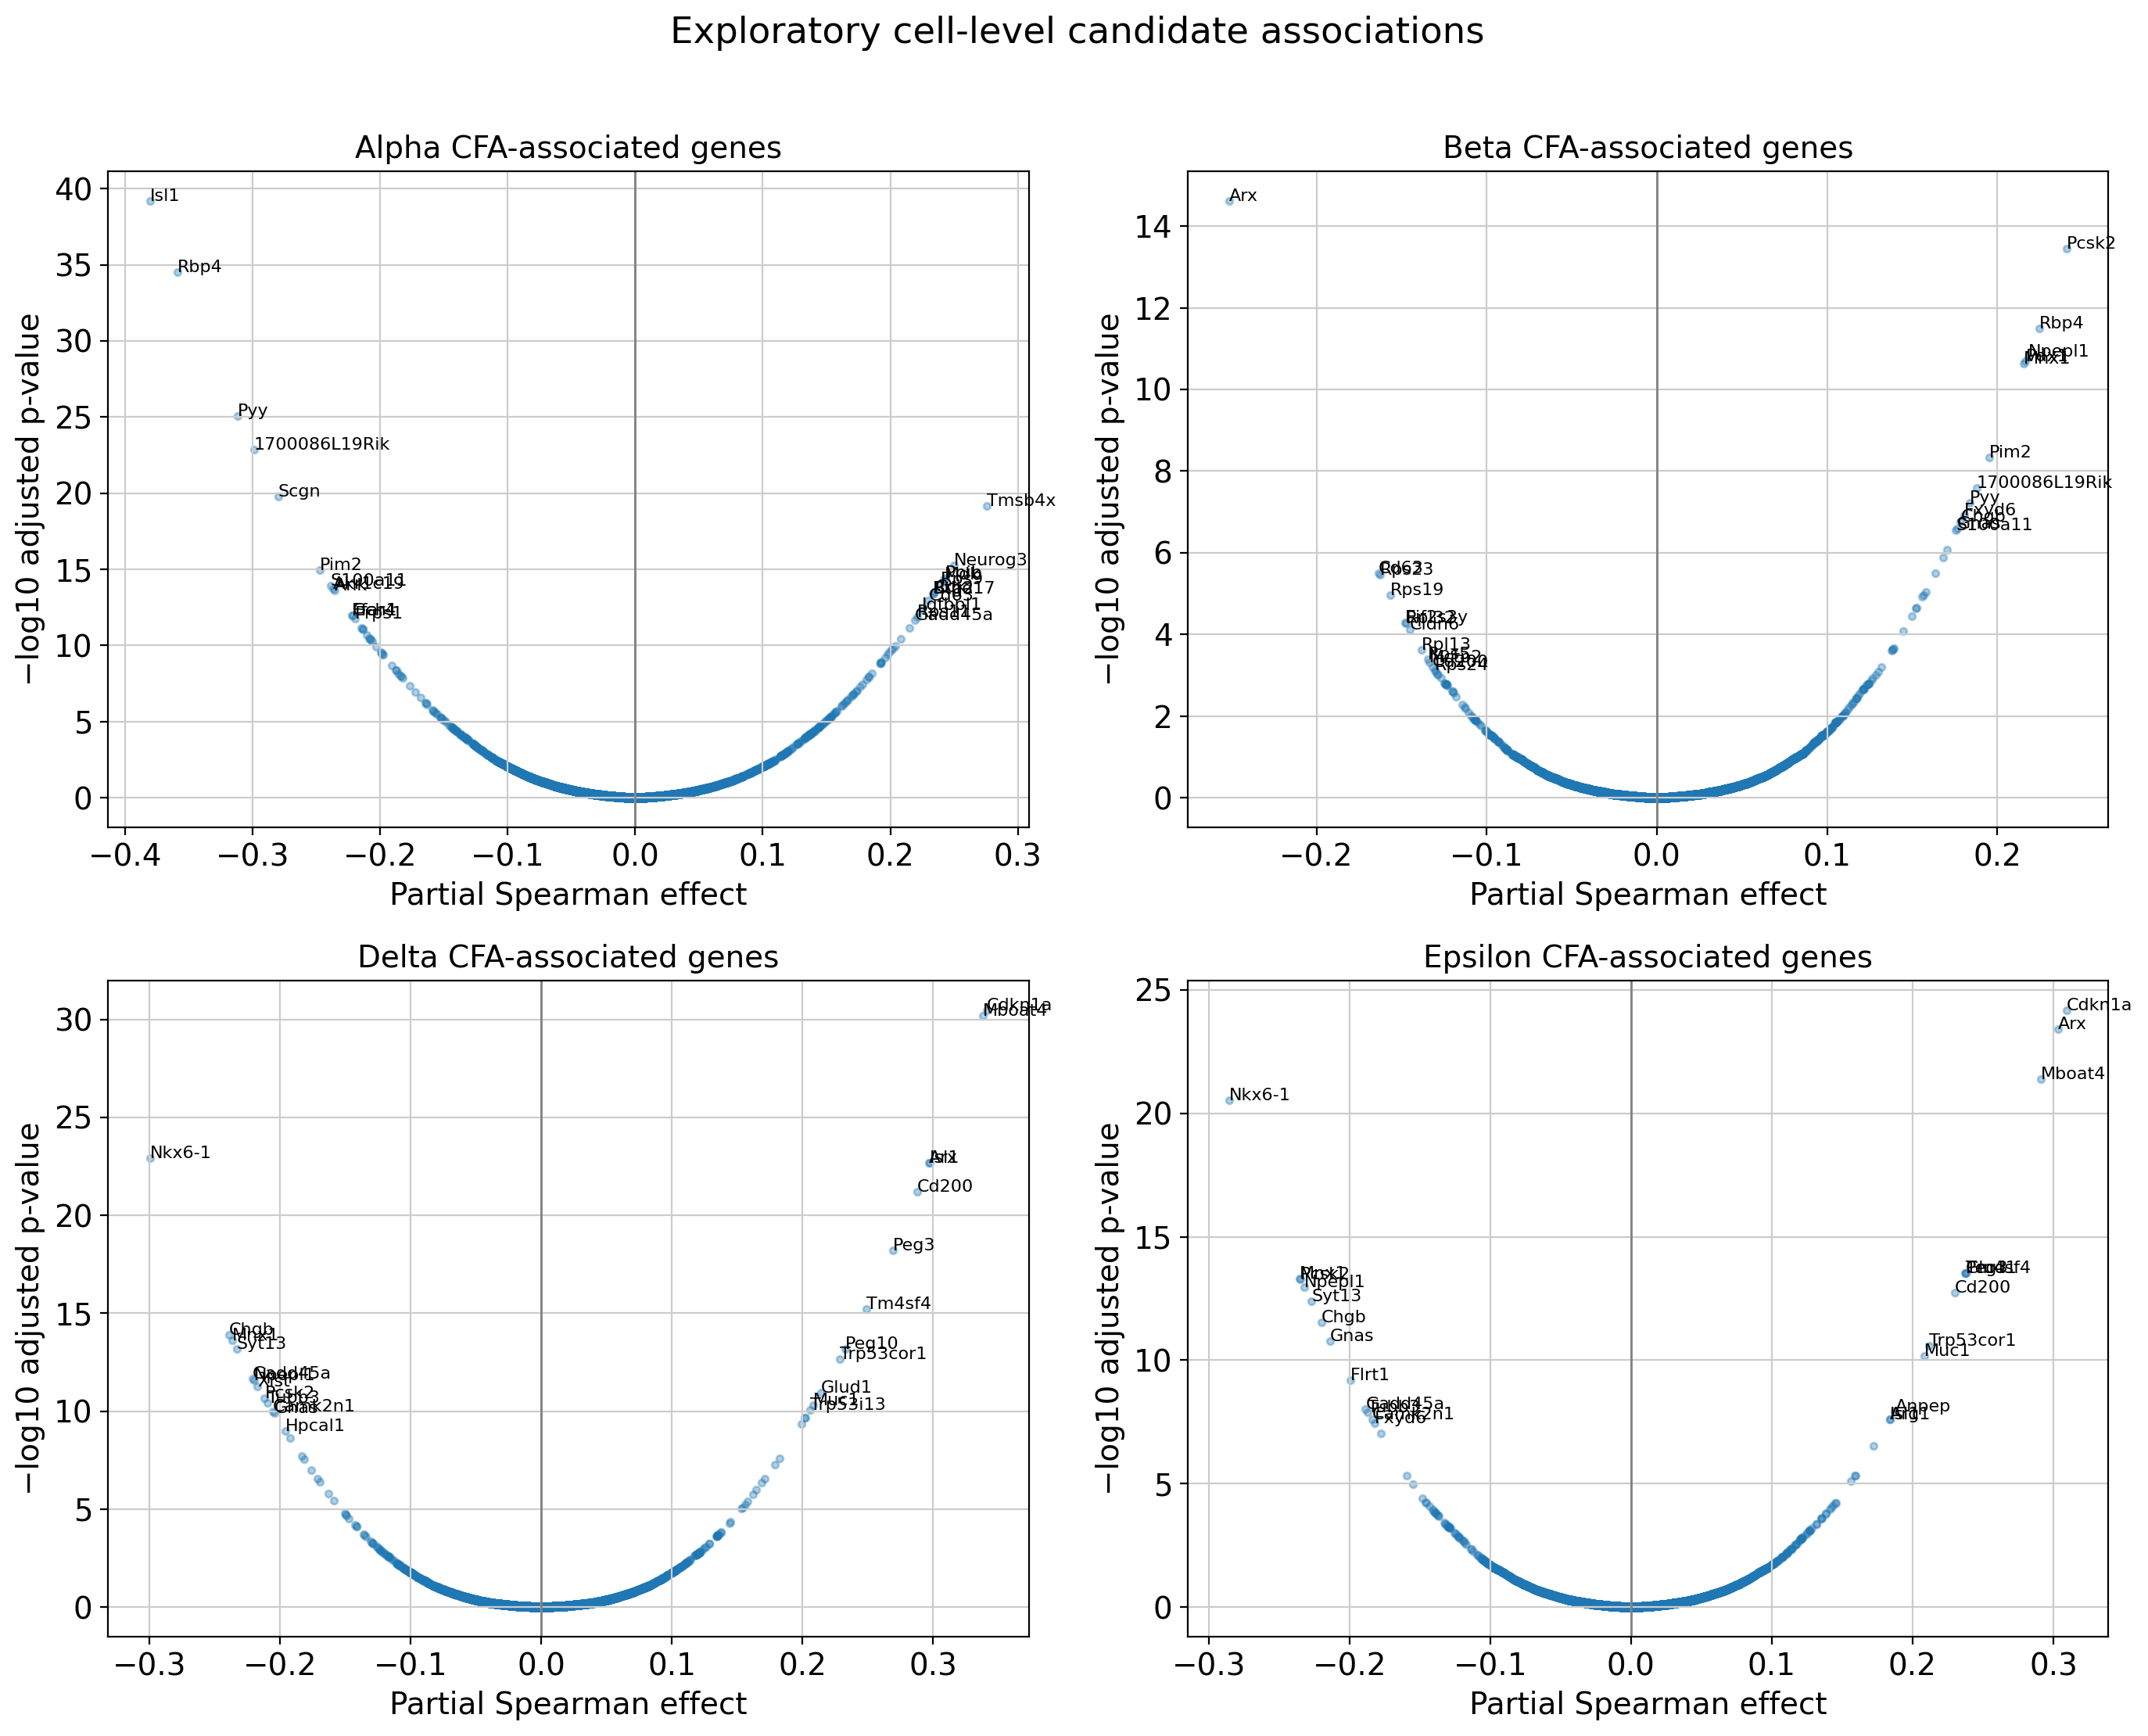
The public pancreas dataset does not provide independent biological replicates for this tutorial. Therefore, cell_exploratory is used only for candidate generation and visualization. The resulting p-values must not be presented as replicate-level evidence.
[11]:
association = scorer.get_commitment_associated_genes(
    outcome="future_fate_affinity",
    fate_names=FATES,
    population="root",
    inference_unit="cell_exploratory",
    pseudotime_key=ORDERING_KEY,
    min_cells=100,
    min_feature_cells=10,
    min_feature_fraction=0.01,
    n_top_genes=50,
    verbose=True,
)
for fate in FATES:
    print("\n", fate)
    display(association.top(fate, n=20))
association.export(OUTPUT_DIR, prefix="pancreas_CFA_association")
[scCS] Candidate commitment-associated genes: Alpha
        inference_unit=cell_exploratory; matrix=X; n_units=1234; tested_genes=6946
 rank     gene   effect   pvalue_adj  significant
    1   Tmsb4x 0.275744 6.866232e-20         True
    2  Neurog3 0.249886 5.188467e-16         True
    3     Ppib 0.242993 3.842847e-15         True
    4      Mdk 0.242233 4.414893e-15         True
    5     Rps9 0.239684 9.050625e-15         True
    6      Cck 0.234886 2.988312e-14         True
    7     Btg2 0.233772 3.955025e-14         True
    8   Btbd17 0.233522 4.020746e-14         True
    9     Cd63 0.229856 1.163901e-13         True
   10  Igfbpl1 0.225002 4.719493e-13         True
   11    Rps11 0.220966 1.330870e-12         True
   12  Gadd45a 0.218992 2.158346e-12         True
   13     Pax4 0.214899 6.643259e-12         True
   14     Cdk4 0.208052 3.532527e-11         True
   15     Dbn1 0.203733 1.012706e-10         True
   16  Smarcd2 0.202143 1.460725e-10         True
   17     Selm 0.200973 1.935800e-10         True
   18     Tecr 0.199264 2.884216e-10         True
   19    Cldn6 0.197887 3.750920e-10         True
   20     Rps5 0.195899 6.087173e-10         True
   21     Rps8 0.193160 1.193368e-09         True
   22    Rps19 0.192583 1.350683e-09         True
   23    Rpl32 0.192380 1.387809e-09         True
   24   Rpl18a 0.192309 1.387809e-09         True
   25   Ifitm2 0.185488 6.752053e-09         True
   26   Rpl37a 0.183151 1.121243e-08         True
   27     Npc2 0.182841 1.186314e-08         True
   28    Rps23 0.181245 1.674072e-08         True
   29   Hpcal1 0.178260 3.310284e-08         True
   30    Cotl1 0.176209 5.144636e-08         True
   31 Ppp1r14a 0.173744 8.875108e-08         True
   32  Sult2b1 0.173058 1.020068e-07         True
   33 BC023829 0.171343 1.453241e-07         True
   34    Epb42 0.170686 1.657214e-07         True
   35      Hn1 0.169934 1.928961e-07         True
   36    Rpl13 0.169175 2.247872e-07         True
   37     Qdpr 0.166513 3.907411e-07         True
   38     Krt7 0.166071 4.240513e-07         True
   39    Rpl28 0.164758 5.547501e-07         True
   40   Rpl10a 0.163476 7.008623e-07         True
   41     Mfng 0.162516 8.374074e-07         True
   42     Gpx2 0.161848 9.518700e-07         True
   43    Tubb3 0.158004 2.040619e-06         True
   44   Eef1a1 0.157407 2.252172e-06         True
   45     Miat 0.157038 2.400241e-06         True
   46     Krt8 0.156340 2.735154e-06         True
   47  Gdap1l1 0.155206 3.327046e-06         True
   48   Cdc14b 0.153799 4.365228e-06         True
   49    Gspt1 0.153310 4.759460e-06         True
   50     Tpm4 0.153258 4.759460e-06         True

[scCS] Candidate commitment-associated genes: Beta
        inference_unit=cell_exploratory; matrix=X; n_units=1234; tested_genes=6946
 rank          gene   effect   pvalue_adj  significant
    1         Pcsk2 0.240656 3.654280e-14         True
    2          Rbp4 0.224756 3.213982e-12         True
    3        Npepl1 0.218365 1.550325e-11         True
    4          Pdx1 0.216645 2.026609e-11         True
    5          Mnx1 0.215440 2.376480e-11         True
    6          Pim2 0.195233 4.638021e-09         True
    7 1700086L19Rik 0.187750 2.629641e-08         True
    8           Pyy 0.183906 5.927710e-08         True
    9         Fxyd6 0.180545 1.184303e-07         True
   10          Chgb 0.178527 1.725473e-07         True
   11          Gnas 0.176425 2.570263e-07         True
   12       S100a11 0.175677 2.816025e-07         True
   13        Pcsk1n 0.170399 8.578265e-07         True
   14         Gng12 0.168234 1.289587e-06         True
   15        Elmod1 0.163479 3.172835e-06         True
   16         Prps1 0.157899 9.108764e-06         True
   17         Anxa4 0.156565 1.089599e-05         True
   18        Sec61b 0.155863 1.191686e-05         True
   19         Syt13 0.152620 2.184586e-05         True
   20       Fam159b 0.152054 2.342385e-05         True
   21        Cryba2 0.149606 3.635226e-05         True
   22          Xist 0.144618 8.142971e-05         True
   23        Klhl32 0.139189 2.147447e-04         True
   24        Papss2 0.138580 2.320391e-04         True
   25      Slc16a12 0.138162 2.350279e-04         True
   26         Flrt1 0.137802 2.434007e-04         True
   27           Fev 0.131738 6.324788e-04         True
   28         Ndc80 0.129850 8.094011e-04         True
   29        Nkx6-1 0.128587 9.539775e-04         True
   30       Hdgfrp3 0.127068 1.172122e-03         True
   31           Cpe 0.125957 1.354105e-03         True
   32        Dynll1 0.124705 1.594843e-03         True
   33         Samd5 0.124436 1.601033e-03         True
   34           Vdr 0.123962 1.633212e-03         True
   35         Plac8 0.123503 1.666802e-03         True
   36          Dlk1 0.122917 1.770042e-03         True
   37          Chga 0.121720 2.108770e-03         True
   38          Frzb 0.121537 2.135643e-03         True
   39         Aurka 0.121349 2.153212e-03         True
   40         Rap1b 0.121283 2.153212e-03         True
   41       Nkiras2 0.120491 2.403087e-03         True
   42        Rab22a 0.119050 2.836916e-03         True
   43         Hmgcr 0.118190 3.196423e-03         True
   44      Arhgef16 0.117264 3.585029e-03         True
   45         Uhrf2 0.117085 3.626002e-03         True
   46          Blnk 0.117009 3.626002e-03         True
   47       Cox7a2l 0.115653 4.401869e-03         True
   48         Kifc1 0.115057 4.753634e-03         True
   49          Ece1 0.114410 5.147539e-03         True
   50        Kcnmb2 0.113165 5.996795e-03         True

[scCS] Candidate commitment-associated genes: Delta
        inference_unit=cell_exploratory; matrix=X; n_units=1234; tested_genes=6946
 rank      gene   effect   pvalue_adj  significant
    1    Cdkn1a 0.341412 3.418676e-31         True
    2    Mboat4 0.338549 6.680157e-31         True
    3      Isl1 0.297690 2.019228e-23         True
    4       Arx 0.297191 2.019228e-23         True
    5     Cd200 0.287990 6.507125e-22         True
    6      Peg3 0.269294 6.235222e-19         True
    7    Tm4sf4 0.249135 5.823501e-16         True
    8     Peg10 0.233154 6.379363e-14         True
    9 Trp53cor1 0.228891 2.157446e-13         True
   10     Glud1 0.214502 1.092584e-11         True
   11      Muc1 0.208587 4.785118e-11         True
   12  Trp53i13 0.206268 8.553140e-11         True
   13      Arg1 0.202316 2.151444e-10         True
   14  Slc16a10 0.202032 2.225874e-10         True
   15     Syne1 0.199276 4.409085e-10         True
   16     Anpep 0.182326 2.592032e-08         True
   17      Hhex 0.178956 5.368210e-08         True
   18     Alcam 0.171484 2.706560e-07         True
   19      Gch1 0.169114 4.310142e-07         True
   20     Mctp2 0.164925 1.042353e-06         True
   21    Nap1l5 0.162142 1.789696e-06         True
   22      Zim1 0.158269 3.818520e-06         True
   23     Sfxn2 0.156223 5.667354e-06         True
   24     Rgs17 0.154249 8.250985e-06         True
   25   Eif2s3y 0.153502 9.367439e-06         True
   26      Hadh 0.144885 4.491779e-05         True
   27  Hepacam2 0.144025 5.176745e-05         True
   28   Fam183b 0.137796 1.506197e-04         True
   29      Cd47 0.137416 1.583615e-04         True
   30       Ghr 0.136067 1.974891e-04         True
   31      Irx2 0.135496 2.115194e-04         True
   32     Gm609 0.135161 2.170621e-04         True
   33  Tmem184c 0.134985 2.202861e-04         True
   34 Serpina1c 0.134610 2.282147e-04         True
   35       Bsg 0.134604 2.282147e-04         True
   36        Gk 0.134439 2.312969e-04         True
   37     Cxxc4 0.134053 2.424613e-04         True
   38      Gde1 0.128558 5.732851e-04         True
   39   Akr1c19 0.128417 5.789863e-04         True
   40   Gm43194 0.126393 7.895596e-04         True
   41     Itm2b 0.125160 9.421049e-04         True
   42    Dusp10 0.124043 1.101894e-03         True
   43       Ttr 0.121885 1.467255e-03         True
   44     Gria2 0.121626 1.505048e-03         True
   45      F11r 0.121578 1.505048e-03         True
   46      Ttc3 0.121258 1.565468e-03         True
   47     Enpp1 0.120790 1.666958e-03         True
   48    Tmem27 0.120671 1.669641e-03         True
   49     Saraf 0.120533 1.669641e-03         True
   50      Gng4 0.120499 1.669641e-03         True

[scCS] Candidate commitment-associated genes: Epsilon
        inference_unit=cell_exploratory; matrix=X; n_units=1234; tested_genes=6946
 rank          gene   effect   pvalue_adj  significant
    1        Cdkn1a 0.309303 6.677054e-25         True
    2           Arx 0.303512 3.788425e-24         True
    3        Mboat4 0.290981 4.025278e-22         True
    4        Tm4sf4 0.237835 2.868121e-14         True
    5          Peg3 0.237758 2.868121e-14         True
    6         Glud1 0.237460 2.868121e-14         True
    7         Cd200 0.229925 1.865291e-13         True
    8     Trp53cor1 0.211789 2.642934e-11         True
    9          Muc1 0.208200 6.648502e-11         True
   10         Anpep 0.187485 1.181492e-08         True
   11          Isl1 0.183961 2.461173e-08         True
   12          Arg1 0.183844 2.461173e-08         True
   13        Nap1l5 0.172484 2.901449e-07         True
   14      Trp53i13 0.159244 4.842869e-06         True
   15         Mctp2 0.158913 4.842869e-06         True
   16         Alcam 0.156351 7.914514e-06         True
   17      Slc16a10 0.145347 6.052592e-05         True
   18         Gsta3 0.144897 6.224458e-05         True
   19         Peg10 0.143662 7.637226e-05         True
   20          Zim1 0.142210 9.493699e-05         True
   21           Bsg 0.141145 1.099295e-04         True
   22        Grin3a 0.138595 1.586106e-04         True
   23     Serpina1c 0.138225 1.631704e-04         True
   24         Sfxn2 0.135531 2.432142e-04         True
   25         Syne1 0.135229 2.515859e-04         True
   26          Irx2 0.134787 2.668251e-04         True
   27         Gria2 0.131847 4.160088e-04         True
   28         Anxa2 0.131817 4.160088e-04         True
   29         Acot1 0.128322 6.409868e-04         True
   30          Dll1 0.127325 7.461387e-04         True
   31       Eif2s3y 0.126966 7.805553e-04         True
   32 1700011H14Rik 0.126720 8.013617e-04         True
   33          Asb4 0.126551 8.125764e-04         True
   34      Pdzk1ip1 0.125224 9.833686e-04         True
   35        Dusp10 0.124273 1.118002e-03         True
   36          F11r 0.122532 1.406444e-03         True
   37           Ttr 0.121221 1.644347e-03         True
   38         Gm609 0.121203 1.644347e-03         True
   39         Wfdc2 0.121193 1.644347e-03         True
   40         Prox1 0.121170 1.644347e-03         True
   41         Habp2 0.120574 1.765007e-03         True
   42       Gm43194 0.120461 1.776364e-03         True
   43         Itm2b 0.120093 1.861033e-03         True
   44          Spp1 0.119633 1.970153e-03         True
   45       Fam107b 0.117576 2.608242e-03         True
   46         P2rx4 0.117305 2.690570e-03         True
   47         Saraf 0.116507 2.978266e-03         True
   48          Tgm2 0.116096 3.138867e-03         True
   49           Clu 0.114376 4.031917e-03         True
   50         Rps19 0.114070 4.179651e-03         True

 Alpha
| gene | effect | pvalue | pvalue_adj | feature_mean | feature_sd | n_detected_cells | n_units | significant | absolute_effect | rank | |
|---|---|---|---|---|---|---|---|---|---|---|---|
| 0 | Tmsb4x | 0.275744 | 5.931096e-23 | 6.866232e-20 | 26.480909 | 25.720442 | 1169 | 1234 | True | 0.275744 | 1 |
| 1 | Neurog3 | 0.249886 | 5.228804e-19 | 5.188467e-16 | 13.379286 | 13.727636 | 988 | 1234 | True | 0.249886 | 2 |
| 2 | Ppib | 0.242993 | 4.979215e-18 | 3.842847e-15 | 8.263345 | 5.597094 | 1201 | 1234 | True | 0.242993 | 3 |
| 3 | Mdk | 0.242233 | 6.356023e-18 | 4.414893e-15 | 15.501658 | 12.948563 | 1124 | 1234 | True | 0.242233 | 4 |
| 4 | Rps9 | 0.239684 | 1.433298e-17 | 9.050625e-15 | 32.504977 | 9.654044 | 1234 | 1234 | True | 0.239684 | 5 |
| 5 | Cck | 0.234886 | 6.453309e-17 | 2.988312e-14 | 20.157887 | 22.982749 | 994 | 1234 | True | 0.234886 | 6 |
| 6 | Btg2 | 0.233772 | 9.110337e-17 | 3.955025e-14 | 8.378012 | 5.691946 | 1196 | 1234 | True | 0.233772 | 7 |
| 7 | Btbd17 | 0.233522 | 9.840581e-17 | 4.020746e-14 | 5.285445 | 5.445983 | 882 | 1234 | True | 0.233522 | 8 |
| 8 | Cd63 | 0.229856 | 3.016156e-16 | 1.163901e-13 | 10.626693 | 5.767550 | 1221 | 1234 | True | 0.229856 | 9 |
| 9 | Igfbpl1 | 0.225002 | 1.290964e-15 | 4.719493e-13 | 2.379176 | 3.276287 | 703 | 1234 | True | 0.225002 | 10 |
| 10 | Rps11 | 0.220966 | 4.215253e-15 | 1.330870e-12 | 22.155707 | 7.528621 | 1234 | 1234 | True | 0.220966 | 11 |
| 11 | Gadd45a | 0.218992 | 7.457573e-15 | 2.158346e-12 | 6.003202 | 7.458282 | 832 | 1234 | True | 0.218992 | 12 |
| 12 | Pax4 | 0.214899 | 2.391038e-14 | 6.643259e-12 | 2.811147 | 2.896685 | 863 | 1234 | True | 0.214899 | 13 |
| 13 | Cdk4 | 0.208052 | 1.594313e-13 | 3.532527e-11 | 7.591262 | 4.271979 | 1200 | 1234 | True | 0.208052 | 14 |
| 14 | Dbn1 | 0.203733 | 5.102894e-13 | 1.012706e-10 | 2.202929 | 2.235892 | 888 | 1234 | True | 0.203733 | 15 |
| 15 | Smarcd2 | 0.202143 | 7.781001e-13 | 1.460725e-10 | 3.190157 | 2.798472 | 999 | 1234 | True | 0.202143 | 16 |
| 16 | Selm | 0.200973 | 1.059032e-12 | 1.935800e-10 | 5.732411 | 5.718559 | 1001 | 1234 | True | 0.200973 | 17 |
| 17 | Tecr | 0.199264 | 1.655557e-12 | 2.884216e-10 | 6.637705 | 4.874872 | 1189 | 1234 | True | 0.199264 | 18 |
| 18 | Cldn6 | 0.197887 | 2.366074e-12 | 3.750920e-10 | 3.883023 | 3.513969 | 1029 | 1234 | True | 0.197887 | 19 |
| 19 | Rps5 | 0.195899 | 3.943605e-12 | 6.087173e-10 | 37.870234 | 10.694716 | 1234 | 1234 | True | 0.195899 | 20 |
Beta
| gene | effect | pvalue | pvalue_adj | feature_mean | feature_sd | n_detected_cells | n_units | significant | absolute_effect | rank | |
|---|---|---|---|---|---|---|---|---|---|---|---|
| 0 | Pcsk2 | 0.240656 | 1.052197e-17 | 3.654280e-14 | 0.824410 | 2.119913 | 285 | 1234 | True | 0.240656 | 1 |
| 1 | Rbp4 | 0.224756 | 1.388129e-15 | 3.213982e-12 | 6.374880 | 17.573840 | 573 | 1234 | True | 0.224756 | 2 |
| 2 | Npepl1 | 0.218365 | 8.927872e-15 | 1.550325e-11 | 1.879040 | 2.161760 | 844 | 1234 | True | 0.218365 | 3 |
| 3 | Pdx1 | 0.216645 | 1.458831e-14 | 2.026609e-11 | 1.220922 | 1.919877 | 586 | 1234 | True | 0.216645 | 4 |
| 4 | Mnx1 | 0.215440 | 2.052819e-14 | 2.376480e-11 | 0.251422 | 0.889925 | 125 | 1234 | True | 0.215440 | 5 |
| 5 | Pim2 | 0.195233 | 4.674078e-12 | 4.638021e-09 | 0.999573 | 1.959778 | 460 | 1234 | True | 0.195233 | 6 |
| 6 | 1700086L19Rik | 0.187750 | 3.028669e-11 | 2.629641e-08 | 1.625739 | 3.346094 | 461 | 1234 | True | 0.187750 | 7 |
| 7 | Pyy | 0.183906 | 7.680592e-11 | 5.927710e-08 | 15.748496 | 61.305059 | 631 | 1234 | True | 0.183906 | 8 |
| 8 | Fxyd6 | 0.180545 | 1.705015e-10 | 1.184303e-07 | 0.975067 | 1.746535 | 455 | 1234 | True | 0.180545 | 9 |
| 9 | Chgb | 0.178527 | 2.732536e-10 | 1.725473e-07 | 26.170255 | 48.147127 | 615 | 1234 | True | 0.178527 | 10 |
| 10 | Gnas | 0.176425 | 4.440420e-10 | 2.570263e-07 | 24.092879 | 17.366661 | 1234 | 1234 | True | 0.176425 | 11 |
| 11 | S100a11 | 0.175677 | 5.270417e-10 | 2.816025e-07 | 2.517067 | 2.615982 | 914 | 1234 | True | 0.175677 | 12 |
| 12 | Pcsk1n | 0.170399 | 1.728991e-09 | 8.578265e-07 | 3.587842 | 6.484170 | 558 | 1234 | True | 0.170399 | 13 |
| 13 | Gng12 | 0.168234 | 2.784883e-09 | 1.289587e-06 | 0.531641 | 1.061274 | 355 | 1234 | True | 0.168234 | 14 |
| 14 | Elmod1 | 0.163479 | 7.765361e-09 | 3.172835e-06 | 0.060351 | 0.287795 | 57 | 1234 | True | 0.163479 | 15 |
| 15 | Prps1 | 0.157899 | 2.491600e-08 | 9.108764e-06 | 0.478884 | 0.964309 | 328 | 1234 | True | 0.157899 | 16 |
| 16 | Anxa4 | 0.156565 | 3.273181e-08 | 1.089599e-05 | 1.785787 | 2.317612 | 721 | 1234 | True | 0.156565 | 17 |
| 17 | Sec61b | 0.155863 | 3.774415e-08 | 1.191686e-05 | 4.848659 | 3.190025 | 1200 | 1234 | True | 0.155863 | 18 |
| 18 | Syt13 | 0.152620 | 7.233727e-08 | 2.184586e-05 | 2.618174 | 2.080583 | 1035 | 1234 | True | 0.152620 | 19 |
| 19 | Fam159b | 0.152054 | 8.093469e-08 | 2.342385e-05 | 0.019040 | 0.209811 | 14 | 1234 | True | 0.152054 | 20 |
Delta
| gene | effect | pvalue | pvalue_adj | feature_mean | feature_sd | n_detected_cells | n_units | significant | absolute_effect | rank | |
|---|---|---|---|---|---|---|---|---|---|---|---|
| 0 | Cdkn1a | 0.341412 | 4.921791e-35 | 3.418676e-31 | 7.192985 | 11.485302 | 930 | 1234 | True | 0.341412 | 1 |
| 1 | Mboat4 | 0.338549 | 1.923454e-34 | 6.680157e-31 | 0.244339 | 1.053657 | 119 | 1234 | True | 0.338549 | 2 |
| 2 | Isl1 | 0.297690 | 1.187606e-26 | 2.019228e-23 | 3.723734 | 8.049448 | 438 | 1234 | True | 0.297690 | 3 |
| 3 | Arx | 0.297191 | 1.453519e-26 | 2.019228e-23 | 0.548678 | 1.612283 | 209 | 1234 | True | 0.297191 | 4 |
| 4 | Cd200 | 0.287990 | 5.620897e-25 | 6.507125e-22 | 0.846095 | 1.491867 | 425 | 1234 | True | 0.287990 | 5 |
| 5 | Peg3 | 0.269294 | 6.283696e-22 | 6.235222e-19 | 5.624904 | 5.022496 | 1143 | 1234 | True | 0.269294 | 6 |
| 6 | Tm4sf4 | 0.249135 | 6.707171e-19 | 5.823501e-16 | 3.366878 | 4.171071 | 862 | 1234 | True | 0.249135 | 7 |
| 7 | Peg10 | 0.233154 | 1.102107e-16 | 6.379363e-14 | 0.182685 | 0.908079 | 72 | 1234 | True | 0.233154 | 8 |
| 8 | Trp53cor1 | 0.228891 | 4.037835e-16 | 2.157446e-13 | 0.106156 | 0.414571 | 95 | 1234 | True | 0.228891 | 9 |
| 9 | Glud1 | 0.214502 | 2.674047e-14 | 1.092584e-11 | 3.630171 | 4.123165 | 972 | 1234 | True | 0.214502 | 10 |
| 10 | Muc1 | 0.208587 | 1.377805e-13 | 4.785118e-11 | 0.439841 | 0.891349 | 326 | 1234 | True | 0.208587 | 11 |
| 11 | Trp53i13 | 0.206268 | 2.585890e-13 | 8.553140e-11 | 0.562178 | 1.028628 | 403 | 1234 | True | 0.206268 | 12 |
| 12 | Arg1 | 0.202316 | 7.433724e-13 | 2.151444e-10 | 0.135893 | 0.751025 | 83 | 1234 | True | 0.202316 | 13 |
| 13 | Slc16a10 | 0.202032 | 8.011352e-13 | 2.225874e-10 | 0.061193 | 0.363854 | 45 | 1234 | True | 0.202032 | 14 |
| 14 | Syne1 | 0.199276 | 1.650392e-12 | 4.409085e-10 | 0.107190 | 0.437560 | 87 | 1234 | True | 0.199276 | 15 |
| 15 | Anpep | 0.182326 | 1.119507e-10 | 2.592032e-08 | 0.294801 | 0.849643 | 224 | 1234 | True | 0.182326 | 16 |
| 16 | Hhex | 0.178956 | 2.473117e-10 | 5.368210e-08 | 0.840135 | 3.748434 | 196 | 1234 | True | 0.178956 | 17 |
| 17 | Alcam | 0.171484 | 1.358231e-09 | 2.706560e-07 | 0.421799 | 0.895275 | 297 | 1234 | True | 0.171484 | 18 |
| 18 | Gch1 | 0.169114 | 2.295930e-09 | 4.310142e-07 | 2.214220 | 3.968295 | 497 | 1234 | True | 0.169114 | 19 |
| 19 | Mctp2 | 0.164925 | 5.702481e-09 | 1.042353e-06 | 0.017739 | 0.159846 | 17 | 1234 | True | 0.164925 | 20 |
Epsilon
| gene | effect | pvalue | pvalue_adj | feature_mean | feature_sd | n_detected_cells | n_units | significant | absolute_effect | rank | |
|---|---|---|---|---|---|---|---|---|---|---|---|
| 0 | Cdkn1a | 0.309303 | 9.612805e-29 | 6.677054e-25 | 7.192985 | 11.485302 | 930 | 1234 | True | 0.309303 | 1 |
| 1 | Arx | 0.303512 | 1.090822e-27 | 3.788425e-24 | 0.548678 | 1.612283 | 209 | 1234 | True | 0.303512 | 2 |
| 2 | Mboat4 | 0.290981 | 1.738531e-25 | 4.025278e-22 | 0.244339 | 1.053657 | 119 | 1234 | True | 0.290981 | 3 |
| 3 | Tm4sf4 | 0.237835 | 2.569547e-17 | 2.868121e-14 | 3.366878 | 4.171071 | 862 | 1234 | True | 0.237835 | 4 |
| 4 | Peg3 | 0.237758 | 2.632457e-17 | 2.868121e-14 | 5.624904 | 5.022496 | 1143 | 1234 | True | 0.237758 | 5 |
| 5 | Glud1 | 0.237460 | 2.890418e-17 | 2.868121e-14 | 3.630171 | 4.123165 | 972 | 1234 | True | 0.237460 | 6 |
| 6 | Cd200 | 0.229925 | 2.953960e-16 | 1.865291e-13 | 0.846095 | 1.491867 | 425 | 1234 | True | 0.229925 | 7 |
| 7 | Trp53cor1 | 0.211789 | 5.707460e-14 | 2.642934e-11 | 0.106156 | 0.414571 | 95 | 1234 | True | 0.211789 | 8 |
| 8 | Muc1 | 0.208200 | 1.531472e-13 | 6.648502e-11 | 0.439841 | 0.891349 | 326 | 1234 | True | 0.208200 | 9 |
| 9 | Anpep | 0.187485 | 3.231839e-11 | 1.181492e-08 | 0.294801 | 0.849643 | 224 | 1234 | True | 0.187485 | 10 |
| 10 | Isl1 | 0.183961 | 7.580492e-11 | 2.461173e-08 | 3.723734 | 8.049448 | 438 | 1234 | True | 0.183961 | 11 |
| 11 | Arg1 | 0.183844 | 7.795250e-11 | 2.461173e-08 | 0.135893 | 0.751025 | 83 | 1234 | True | 0.183844 | 12 |
| 12 | Nap1l5 | 0.172484 | 1.086059e-09 | 2.901449e-07 | 0.037859 | 0.316134 | 27 | 1234 | True | 0.172484 | 13 |
| 13 | Trp53i13 | 0.159244 | 1.888294e-08 | 4.842869e-06 | 0.562178 | 1.028628 | 403 | 1234 | True | 0.159244 | 14 |
| 14 | Mctp2 | 0.158913 | 2.021929e-08 | 4.842869e-06 | 0.017739 | 0.159846 | 17 | 1234 | True | 0.158913 | 15 |
| 15 | Alcam | 0.156351 | 3.418304e-08 | 7.914514e-06 | 0.421799 | 0.895275 | 297 | 1234 | True | 0.156351 | 16 |
| 16 | Slc16a10 | 0.145347 | 2.962686e-07 | 6.052592e-05 | 0.061193 | 0.363854 | 45 | 1234 | True | 0.145347 | 17 |
| 17 | Gsta3 | 0.144897 | 3.226037e-07 | 6.224458e-05 | 0.195227 | 0.672787 | 144 | 1234 | True | 0.144897 | 18 |
| 18 | Peg10 | 0.143662 | 4.068203e-07 | 7.637226e-05 | 0.182685 | 0.908079 | 72 | 1234 | True | 0.143662 | 19 |
| 19 | Zim1 | 0.142210 | 5.330467e-07 | 9.493699e-05 | 0.116127 | 0.372238 | 118 | 1234 | True | 0.142210 | 20 |
[11]:
['tutorial_outputs/pancreas_downstream/pancreas_CFA_association_Alpha.csv',
 'tutorial_outputs/pancreas_downstream/pancreas_CFA_association_Beta.csv',
 'tutorial_outputs/pancreas_downstream/pancreas_CFA_association_Delta.csv',
 'tutorial_outputs/pancreas_downstream/pancreas_CFA_association_Epsilon.csv',
 'tutorial_outputs/pancreas_downstream/pancreas_CFA_association_metadata.json']
[12]:
fig, axes = plt.subplots(2, 2, figsize=(14, 11))
for axis, fate in zip(axes.ravel(), FATES):
    table = association.tables[fate].copy()
    shown = pd.concat(
        [
            table.nlargest(12, "effect"),
            table.nsmallest(12, "effect"),
        ]
    ).drop_duplicates("gene")
    axis.scatter(
        table["effect"],
        -np.log10(table["pvalue_adj"].clip(lower=1e-300)),
        s=10,
        alpha=0.35,
    )
    for row in shown.itertuples():
        axis.text(
            row.effect,
            -np.log10(max(row.pvalue_adj, 1e-300)),
            row.gene,
            fontsize=8,
        )
    axis.axvline(0, color="0.5", linewidth=1)
    axis.set_title(f"{fate} CFA-associated genes")
    axis.set_xlabel("Partial Spearman effect")
    axis.set_ylabel("−log10 adjusted p-value")
fig.suptitle("Exploratory cell-level candidate associations", y=1.01)
fig.tight_layout()
fig.savefig(OUTPUT_DIR / "CFA_association_volcanoes.png", dpi=200, bbox_inches="tight")
plt.show()
10. Fate markers versus commitment-associated genes
Fate markers compare annotated terminal cells with the root. Commitment associations are calculated within the selected analysis population and can identify genes varying before terminal identity is fully established.
[13]:
fate_markers = scorer.get_fate_markers(
    method="wilcoxon",
    fdr_threshold=0.05,
    logfc_threshold=0.25,
    min_cells=10,
    verbose=True,
)
for fate, table in fate_markers.items():
    table.to_csv(OUTPUT_DIR / f"fate_markers_{fate}.csv", index=False)
    print("\n", fate)
    display(table.head(20))
ranking genes
    finished (0:00:00)

[scCS] Fate markers: Alpha vs root; significant=2275
 rank    gene  logfoldchange    pvalue_adj
    1     Pyy     233.343811 1.051944e-160
    2     Gcg     209.721115  1.613987e-83
    3    Iapp     100.156334 3.267432e-138
    4     Ttr      69.962547 3.499607e-146
    5    Gnas      51.120472 2.153794e-130
    6    Rbp4      43.370220 7.934233e-127
    7   Hpgds      26.723766  1.768276e-02
    8     Tnr      26.722797  1.221011e-02
   21  Tmem27      18.768389 3.627194e-200
   22 Slc38a5      18.712347 1.562776e-124
   23  Pcsk1n      17.453619 6.113637e-142
   24     Cpe      13.869763 1.434444e-125
   25 Slc25a5      12.463739  3.970180e-52
   26    Gast      11.470784  3.008741e-52
   27   Pcsk2       9.351954 1.479988e-117
   28    Gpx3       8.338355 3.580264e-131
   29   Meis2       8.270338 1.147131e-145
   30   Peg10       7.708434  2.012753e-97
   31     Ppy       7.698100  3.638924e-25
   32    Isl1       7.264405  2.414985e-71
ranking genes
    finished (0:00:00)

[scCS] Fate markers: Beta vs root; significant=2516
 rank    gene  logfoldchange    pvalue_adj
    1    Iapp     186.131287 1.182187e-212
    2     Pyy     162.698456 1.170819e-166
    3    Ins1      99.442055  1.314981e-65
    4    Rbp4      50.622169 2.567789e-195
    5    Ins2      48.017612  9.881409e-92
    6    Gnas      42.680595 7.839004e-158
    7    Nnat      42.575066 3.539079e-142
   11     Ttr      25.199047  7.322854e-82
   22  Sec61b      13.772089 1.602273e-188
   23    Dlk1      13.032376 4.344538e-143
   24  Pcsk1n      11.741943 4.973997e-133
   25 Ppp1r1a      11.731724 5.904462e-129
   26     Npy      11.361814  6.546743e-10
   27   Pcsk2      10.887548 2.477486e-210
   28 Slc38a5       8.947008 5.318520e-109
   29     Cpe       8.691454  3.550664e-97
   30  Malat1       8.601723  3.752770e-08
   31     Gip       8.531458  3.147848e-21
   32   Hspa5       8.391294 3.347481e-145
   33   G6pc2       8.110472  2.820160e-49
ranking genes
    finished (0:00:00)

[scCS] Fate markers: Delta vs root; significant=798
 rank    gene  logfoldchange   pvalue_adj
    1     Pyy     507.735718 1.707881e-38
    2     Sst     333.075989 3.239883e-31
    3    Rbp4     204.135147 3.087391e-40
    4    Iapp     103.372108 3.450474e-38
    5  Ptprz1      28.902637 4.037080e-03
   11  Malat1      20.850237 2.335053e-07
   12     Ppy      20.007435 2.511014e-08
   13    Hhex      18.528818 2.771210e-36
   14    Dlk1      17.492176 3.239883e-31
   15   Cd24a      17.178232 9.241425e-29
   16    Gnas      16.492489 1.108358e-09
   17    Isl1      14.357853 2.157751e-24
   18    Gpx3      10.721635 2.015825e-30
   19    Ssr2      10.476543 9.734139e-28
   20   Pcsk2      10.011806 2.975781e-28
   21     Ttr       9.984013 9.294936e-04
   22    Hadh       9.676562 2.701236e-34
   23    Arg1       9.438912 6.021122e-32
   24 Fam183b       8.570268 5.275840e-25
   25   Meis2       7.521049 5.229345e-28
ranking genes
    finished (0:00:00)

[scCS] Fate markers: Epsilon vs root; significant=1228
 rank    gene  logfoldchange   pvalue_adj
    1    Ghrl     496.845154 1.711900e-80
    2     Pyy     105.076279 1.520765e-33
    3    Rbp4      84.230026 1.166756e-63
    4  Lrpprc      26.874617 2.212602e-35
   10    Isl1      23.863163 5.599882e-57
   16  Cdkn1a      20.302576 1.014479e-09
   17     Gcg      20.285036 8.288713e-05
   18    Iapp      19.742641 2.165407e-31
   19     Ttr      18.806128 4.338757e-05
   20  Maged2      16.161346 1.336546e-53
   21     Bsg      13.106299 2.802268e-52
   22 Slc38a5      10.352853 2.793423e-28
   23  Tmem27      10.297958 4.252569e-35
   24   Hspa5       9.316794 1.551241e-41
   25   Itm2b       8.679244 9.753602e-37
   26 Fam183b       8.656516 3.120110e-44
   27    Gnas       8.329838 7.783550e-03
   28    Ssr2       8.275435 4.458118e-48
   29    Arg1       7.801110 3.470800e-39
   31    Gast       6.628323 1.065891e-07

 Alpha
| gene | score | logfoldchange | pvalue | pvalue_adj | pct_terminal | significant | analysis_type | rank | |
|---|---|---|---|---|---|---|---|---|---|
| 0 | Pyy | 27.298784 | 233.343811 | 4.384929e-164 | 1.051944e-160 | 0.968815 | True | terminal_annotation_marker_vs_root | 1 |
| 1 | Gcg | 19.606232 | 209.721115 | 1.367976e-85 | 1.613987e-83 | 0.656965 | True | terminal_annotation_marker_vs_root | 2 |
| 2 | Iapp | 25.275759 | 100.156334 | 5.901990e-141 | 3.267432e-138 | 0.854470 | True | terminal_annotation_marker_vs_root | 3 |
| 3 | Ttr | 26.014395 | 69.962547 | 3.403814e-149 | 3.499607e-146 | 1.000000 | True | terminal_annotation_marker_vs_root | 4 |
| 4 | Gnas | 24.545862 | 51.120472 | 4.788205e-133 | 2.153794e-130 | 1.000000 | True | terminal_annotation_marker_vs_root | 5 |
| 5 | Rbp4 | 24.200369 | 43.370220 | 2.204872e-129 | 7.934233e-127 | 0.962578 | True | terminal_annotation_marker_vs_root | 6 |
| 6 | Hpgds | 2.812783 | 26.723766 | 4.911470e-03 | 1.768276e-02 | 0.087318 | True | terminal_annotation_marker_vs_root | 7 |
| 7 | Tnr | 2.946726 | 26.722797 | 3.211580e-03 | 1.221011e-02 | 0.091476 | True | terminal_annotation_marker_vs_root | 8 |
| 8 | Dpp10 | 1.406392 | 25.546453 | 1.596078e-01 | 3.284975e-01 | 0.043659 | False | terminal_annotation_marker_vs_root | 9 |
| 9 | Kcnip4 | 0.803652 | 24.992832 | 4.215977e-01 | 6.472897e-01 | 0.024948 | False | terminal_annotation_marker_vs_root | 10 |
| 10 | Cntn1 | 0.803652 | 24.814041 | 4.215977e-01 | 6.472897e-01 | 0.024948 | False | terminal_annotation_marker_vs_root | 11 |
| 11 | Sorcs1 | 0.803652 | 24.681318 | 4.215977e-01 | 6.472897e-01 | 0.024948 | False | terminal_annotation_marker_vs_root | 12 |
| 12 | Cntnap5b | 0.535768 | 24.193756 | 5.921187e-01 | 7.905839e-01 | 0.016632 | False | terminal_annotation_marker_vs_root | 13 |
| 13 | Nlgn1 | 0.401826 | 23.765213 | 6.878119e-01 | 8.604524e-01 | 0.012474 | False | terminal_annotation_marker_vs_root | 14 |
| 14 | Cdh23 | 0.200913 | 22.676788 | 8.407665e-01 | 9.450252e-01 | 0.006237 | False | terminal_annotation_marker_vs_root | 15 |
| 15 | Dlg2 | 0.200913 | 22.563169 | 8.407665e-01 | 9.450252e-01 | 0.006237 | False | terminal_annotation_marker_vs_root | 16 |
| 16 | Ptprz1 | 0.200913 | 22.523197 | 8.407665e-01 | 9.450252e-01 | 0.006237 | False | terminal_annotation_marker_vs_root | 17 |
| 17 | Sntg1 | 0.066971 | 20.907154 | 9.466048e-01 | 9.868608e-01 | 0.002079 | False | terminal_annotation_marker_vs_root | 18 |
| 18 | Cdh6 | 0.066971 | 20.481556 | 9.466048e-01 | 9.868608e-01 | 0.002079 | False | terminal_annotation_marker_vs_root | 19 |
| 19 | Lsamp | 0.066971 | 20.481556 | 9.466048e-01 | 9.868608e-01 | 0.002079 | False | terminal_annotation_marker_vs_root | 20 |
Beta
| gene | score | logfoldchange | pvalue | pvalue_adj | pct_terminal | significant | analysis_type | rank | |
|---|---|---|---|---|---|---|---|---|---|
| 0 | Iapp | 31.406631 | 186.131287 | 1.642611e-216 | 1.182187e-212 | 0.944162 | True | terminal_annotation_marker_vs_root | 1 |
| 1 | Pyy | 27.752472 | 162.698456 | 1.626816e-169 | 1.170819e-166 | 0.962775 | True | terminal_annotation_marker_vs_root | 2 |
| 2 | Ins1 | 17.335060 | 99.442055 | 2.557974e-67 | 1.314981e-65 | 0.582064 | True | terminal_annotation_marker_vs_root | 3 |
| 3 | Rbp4 | 30.064129 | 50.622169 | 1.427144e-198 | 2.567789e-195 | 0.996616 | True | terminal_annotation_marker_vs_root | 4 |
| 4 | Ins2 | 20.527544 | 48.017612 | 1.221961e-93 | 9.881409e-92 | 0.610829 | True | terminal_annotation_marker_vs_root | 5 |
| 5 | Gnas | 27.004543 | 42.680595 | 1.307045e-160 | 7.839004e-158 | 1.000000 | True | terminal_annotation_marker_vs_root | 6 |
| 6 | Nnat | 25.606888 | 42.575066 | 1.278533e-144 | 3.539079e-142 | 0.825719 | True | terminal_annotation_marker_vs_root | 7 |
| 7 | Cdh23 | 1.639956 | 25.650280 | 1.010144e-01 | 2.167563e-01 | 0.047377 | False | terminal_annotation_marker_vs_root | 8 |
| 8 | Ptprz1 | 1.815665 | 25.624140 | 6.942174e-02 | 1.598811e-01 | 0.052453 | False | terminal_annotation_marker_vs_root | 9 |
| 9 | Tnr | 1.698526 | 25.451895 | 8.940862e-02 | 1.963606e-01 | 0.049069 | False | terminal_annotation_marker_vs_root | 10 |
| 10 | Ttr | 19.382299 | 25.199047 | 1.088711e-83 | 7.322854e-82 | 0.994924 | True | terminal_annotation_marker_vs_root | 11 |
| 11 | Sntg1 | 0.995687 | 24.867790 | 3.194021e-01 | 5.239883e-01 | 0.028765 | False | terminal_annotation_marker_vs_root | 12 |
| 12 | Dpp10 | 0.937118 | 24.725800 | 3.486981e-01 | 5.561050e-01 | 0.027073 | False | terminal_annotation_marker_vs_root | 13 |
| 13 | Hpgds | 1.054257 | 24.674431 | 2.917652e-01 | 4.899286e-01 | 0.030457 | False | terminal_annotation_marker_vs_root | 14 |
| 14 | Cntn1 | 0.702838 | 24.308039 | 4.821566e-01 | 6.856934e-01 | 0.020305 | False | terminal_annotation_marker_vs_root | 15 |
| 15 | Nlgn1 | 0.292849 | 23.271965 | 7.696374e-01 | 8.987686e-01 | 0.008460 | False | terminal_annotation_marker_vs_root | 16 |
| 16 | Cntnap5b | 0.175710 | 22.454672 | 8.605221e-01 | 9.479838e-01 | 0.005076 | False | terminal_annotation_marker_vs_root | 17 |
| 17 | Kcnip4 | 0.175710 | 22.304205 | 8.605221e-01 | 9.479838e-01 | 0.005076 | False | terminal_annotation_marker_vs_root | 18 |
| 18 | Dlg2 | 0.058570 | 20.705379 | 9.532947e-01 | 9.837292e-01 | 0.001692 | False | terminal_annotation_marker_vs_root | 19 |
| 19 | Lsamp | 0.058570 | 20.256542 | 9.532947e-01 | 9.837292e-01 | 0.001692 | False | terminal_annotation_marker_vs_root | 20 |
Delta
| gene | score | logfoldchange | pvalue | pvalue_adj | pct_terminal | significant | analysis_type | rank | |
|---|---|---|---|---|---|---|---|---|---|
| 0 | Pyy | 13.587565 | 507.735718 | 4.746092e-42 | 1.707881e-38 | 1.000000 | True | terminal_annotation_marker_vs_root | 1 |
| 1 | Sst | 12.178400 | 333.075989 | 4.051542e-34 | 3.239883e-31 | 0.871429 | True | terminal_annotation_marker_vs_root | 2 |
| 2 | Rbp4 | 13.927866 | 204.135147 | 4.289831e-44 | 3.087391e-40 | 1.000000 | True | terminal_annotation_marker_vs_root | 3 |
| 3 | Iapp | 13.506161 | 103.372108 | 1.438297e-41 | 3.450474e-38 | 0.985714 | True | terminal_annotation_marker_vs_root | 4 |
| 4 | Ptprz1 | 3.623568 | 28.902637 | 2.905666e-04 | 4.037080e-03 | 0.257143 | True | terminal_annotation_marker_vs_root | 5 |
| 5 | Cntn1 | 1.409165 | 27.251200 | 1.587863e-01 | 5.970662e-01 | 0.100000 | False | terminal_annotation_marker_vs_root | 6 |
| 6 | Hpgds | 1.207856 | 26.802217 | 2.271026e-01 | 7.303207e-01 | 0.085714 | False | terminal_annotation_marker_vs_root | 7 |
| 7 | Tnr | 1.409165 | 26.669956 | 1.587863e-01 | 5.970662e-01 | 0.100000 | False | terminal_annotation_marker_vs_root | 8 |
| 8 | Dpp10 | 0.805237 | 26.087811 | 4.206827e-01 | 9.597528e-01 | 0.057143 | False | terminal_annotation_marker_vs_root | 9 |
| 9 | Nlgn1 | 0.201309 | 24.924381 | 8.404567e-01 | 1.000000e+00 | 0.014286 | False | terminal_annotation_marker_vs_root | 10 |
| 10 | Malat1 | 5.792293 | 20.850237 | 6.943189e-09 | 2.335053e-07 | 1.000000 | True | terminal_annotation_marker_vs_root | 11 |
| 11 | Ppy | 6.192138 | 20.007435 | 5.935342e-10 | 2.511014e-08 | 0.485714 | True | terminal_annotation_marker_vs_root | 12 |
| 12 | Hhex | 13.157539 | 18.528818 | 1.540203e-39 | 2.771210e-36 | 0.985714 | True | terminal_annotation_marker_vs_root | 13 |
| 13 | Dlk1 | 12.181336 | 17.492176 | 3.908267e-34 | 3.239883e-31 | 1.000000 | True | terminal_annotation_marker_vs_root | 14 |
| 14 | Cd24a | 11.691277 | 17.178232 | 1.412473e-31 | 9.241425e-29 | 1.000000 | True | terminal_annotation_marker_vs_root | 15 |
| 15 | Gnas | 6.687908 | 16.492489 | 2.263842e-11 | 1.108358e-09 | 1.000000 | True | terminal_annotation_marker_vs_root | 16 |
| 16 | Isl1 | 10.758631 | 14.357853 | 5.396626e-27 | 2.157751e-24 | 1.000000 | True | terminal_annotation_marker_vs_root | 17 |
| 17 | Gpx3 | 12.019669 | 10.721635 | 2.800925e-33 | 2.015825e-30 | 0.985714 | True | terminal_annotation_marker_vs_root | 18 |
| 18 | Ssr2 | 11.468760 | 10.476543 | 1.893538e-30 | 9.734139e-28 | 1.000000 | True | terminal_annotation_marker_vs_root | 19 |
| 19 | Pcsk2 | 11.584097 | 10.011806 | 4.961703e-31 | 2.975781e-28 | 0.928571 | True | terminal_annotation_marker_vs_root | 20 |
Epsilon
| gene | score | logfoldchange | pvalue | pvalue_adj | pct_terminal | significant | analysis_type | rank | |
|---|---|---|---|---|---|---|---|---|---|
| 0 | Ghrl | 19.460413 | 496.845154 | 2.378630e-84 | 1.711900e-80 | 1.000000 | True | terminal_annotation_marker_vs_root | 1 |
| 1 | Pyy | 12.460391 | 105.076279 | 1.227675e-35 | 1.520765e-33 | 0.873239 | True | terminal_annotation_marker_vs_root | 2 |
| 2 | Rbp4 | 17.321424 | 84.230026 | 3.242339e-67 | 1.166756e-63 | 0.992958 | True | terminal_annotation_marker_vs_root | 3 |
| 3 | Lrpprc | 12.808173 | 26.874617 | 1.475683e-37 | 2.212602e-35 | 0.873239 | True | terminal_annotation_marker_vs_root | 4 |
| 4 | Tnr | 1.788753 | 26.569187 | 7.365458e-02 | 2.781175e-01 | 0.091549 | False | terminal_annotation_marker_vs_root | 5 |
| 5 | Hpgds | 1.375964 | 26.106819 | 1.688328e-01 | 4.925373e-01 | 0.070423 | False | terminal_annotation_marker_vs_root | 6 |
| 6 | Sorcs1 | 0.550386 | 25.018215 | 5.820549e-01 | 9.302797e-01 | 0.028169 | False | terminal_annotation_marker_vs_root | 7 |
| 7 | Cntn1 | 0.412789 | 24.271919 | 6.797611e-01 | 9.705308e-01 | 0.021127 | False | terminal_annotation_marker_vs_root | 8 |
| 8 | Nlgn1 | 0.412789 | 24.233652 | 6.797611e-01 | 9.705308e-01 | 0.021127 | False | terminal_annotation_marker_vs_root | 9 |
| 9 | Isl1 | 16.356800 | 23.863163 | 3.890428e-60 | 5.599882e-57 | 0.992958 | True | terminal_annotation_marker_vs_root | 10 |
| 10 | Kcnip4 | 0.275193 | 23.464123 | 7.831681e-01 | 9.975780e-01 | 0.014085 | False | terminal_annotation_marker_vs_root | 11 |
| 11 | Cntnap5b | 0.275193 | 23.415113 | 7.831681e-01 | 9.975780e-01 | 0.014085 | False | terminal_annotation_marker_vs_root | 12 |
| 12 | Dpp10 | 0.137596 | 23.186213 | 8.905594e-01 | 1.000000e+00 | 0.007042 | False | terminal_annotation_marker_vs_root | 13 |
| 13 | Dlg2 | 0.137596 | 22.930840 | 8.905594e-01 | 1.000000e+00 | 0.007042 | False | terminal_annotation_marker_vs_root | 14 |
| 14 | Ptprz1 | 0.137596 | 22.502655 | 8.905594e-01 | 1.000000e+00 | 0.007042 | False | terminal_annotation_marker_vs_root | 15 |
| 15 | Cdkn1a | 6.598829 | 20.302576 | 4.144183e-11 | 1.014479e-09 | 0.887324 | True | terminal_annotation_marker_vs_root | 16 |
| 16 | Gcg | 4.514143 | 20.285036 | 6.357328e-06 | 8.288713e-05 | 0.338028 | True | terminal_annotation_marker_vs_root | 17 |
| 17 | Iapp | 12.045594 | 19.742641 | 2.045959e-33 | 2.165407e-31 | 0.760563 | True | terminal_annotation_marker_vs_root | 18 |
| 18 | Ttr | 4.656311 | 18.806128 | 3.219253e-06 | 4.338757e-05 | 0.929577 | True | terminal_annotation_marker_vs_root | 19 |
| 19 | Maged2 | 15.854918 | 16.161346 | 1.299961e-56 | 1.336546e-53 | 0.943662 | True | terminal_annotation_marker_vs_root | 20 |
[14]:
overlap_rows = []
for fate in FATES:
    association_genes = set(association.top(fate, n=100, positive_only=True)["gene"])
    marker_genes = set(fate_markers[fate].head(100)["gene"])
    overlap_rows.append(
        {
            "fate": fate,
            "top_association_genes": len(association_genes),
            "top_marker_genes": len(marker_genes),
            "overlap": len(association_genes & marker_genes),
            "overlap_genes": ", ".join(sorted(association_genes & marker_genes)),
        }
    )
overlap_table = pd.DataFrame(overlap_rows)
display(overlap_table)
overlap_table.to_csv(OUTPUT_DIR / "association_marker_overlap.csv", index=False)
| fate | top_association_genes | top_marker_genes | overlap | overlap_genes | |
|---|---|---|---|---|---|
| 0 | Alpha | 100 | 100 | 0 | |
| 1 | Beta | 100 | 100 | 20 | 1700086L19Rik, Chga, Cpe, Dlk1, Dynll1, Fam159... |
| 2 | Delta | 100 | 100 | 15 | Arg1, Bsg, Cd200, Cd24a, Fam183b, Ghr, Gria2, ... |
| 3 | Epsilon | 100 | 100 | 22 | Alcam, Anpep, Arg1, Arx, Bsg, Cdkn1a, Cpn1, En... |
11. Reproducible local enrichment
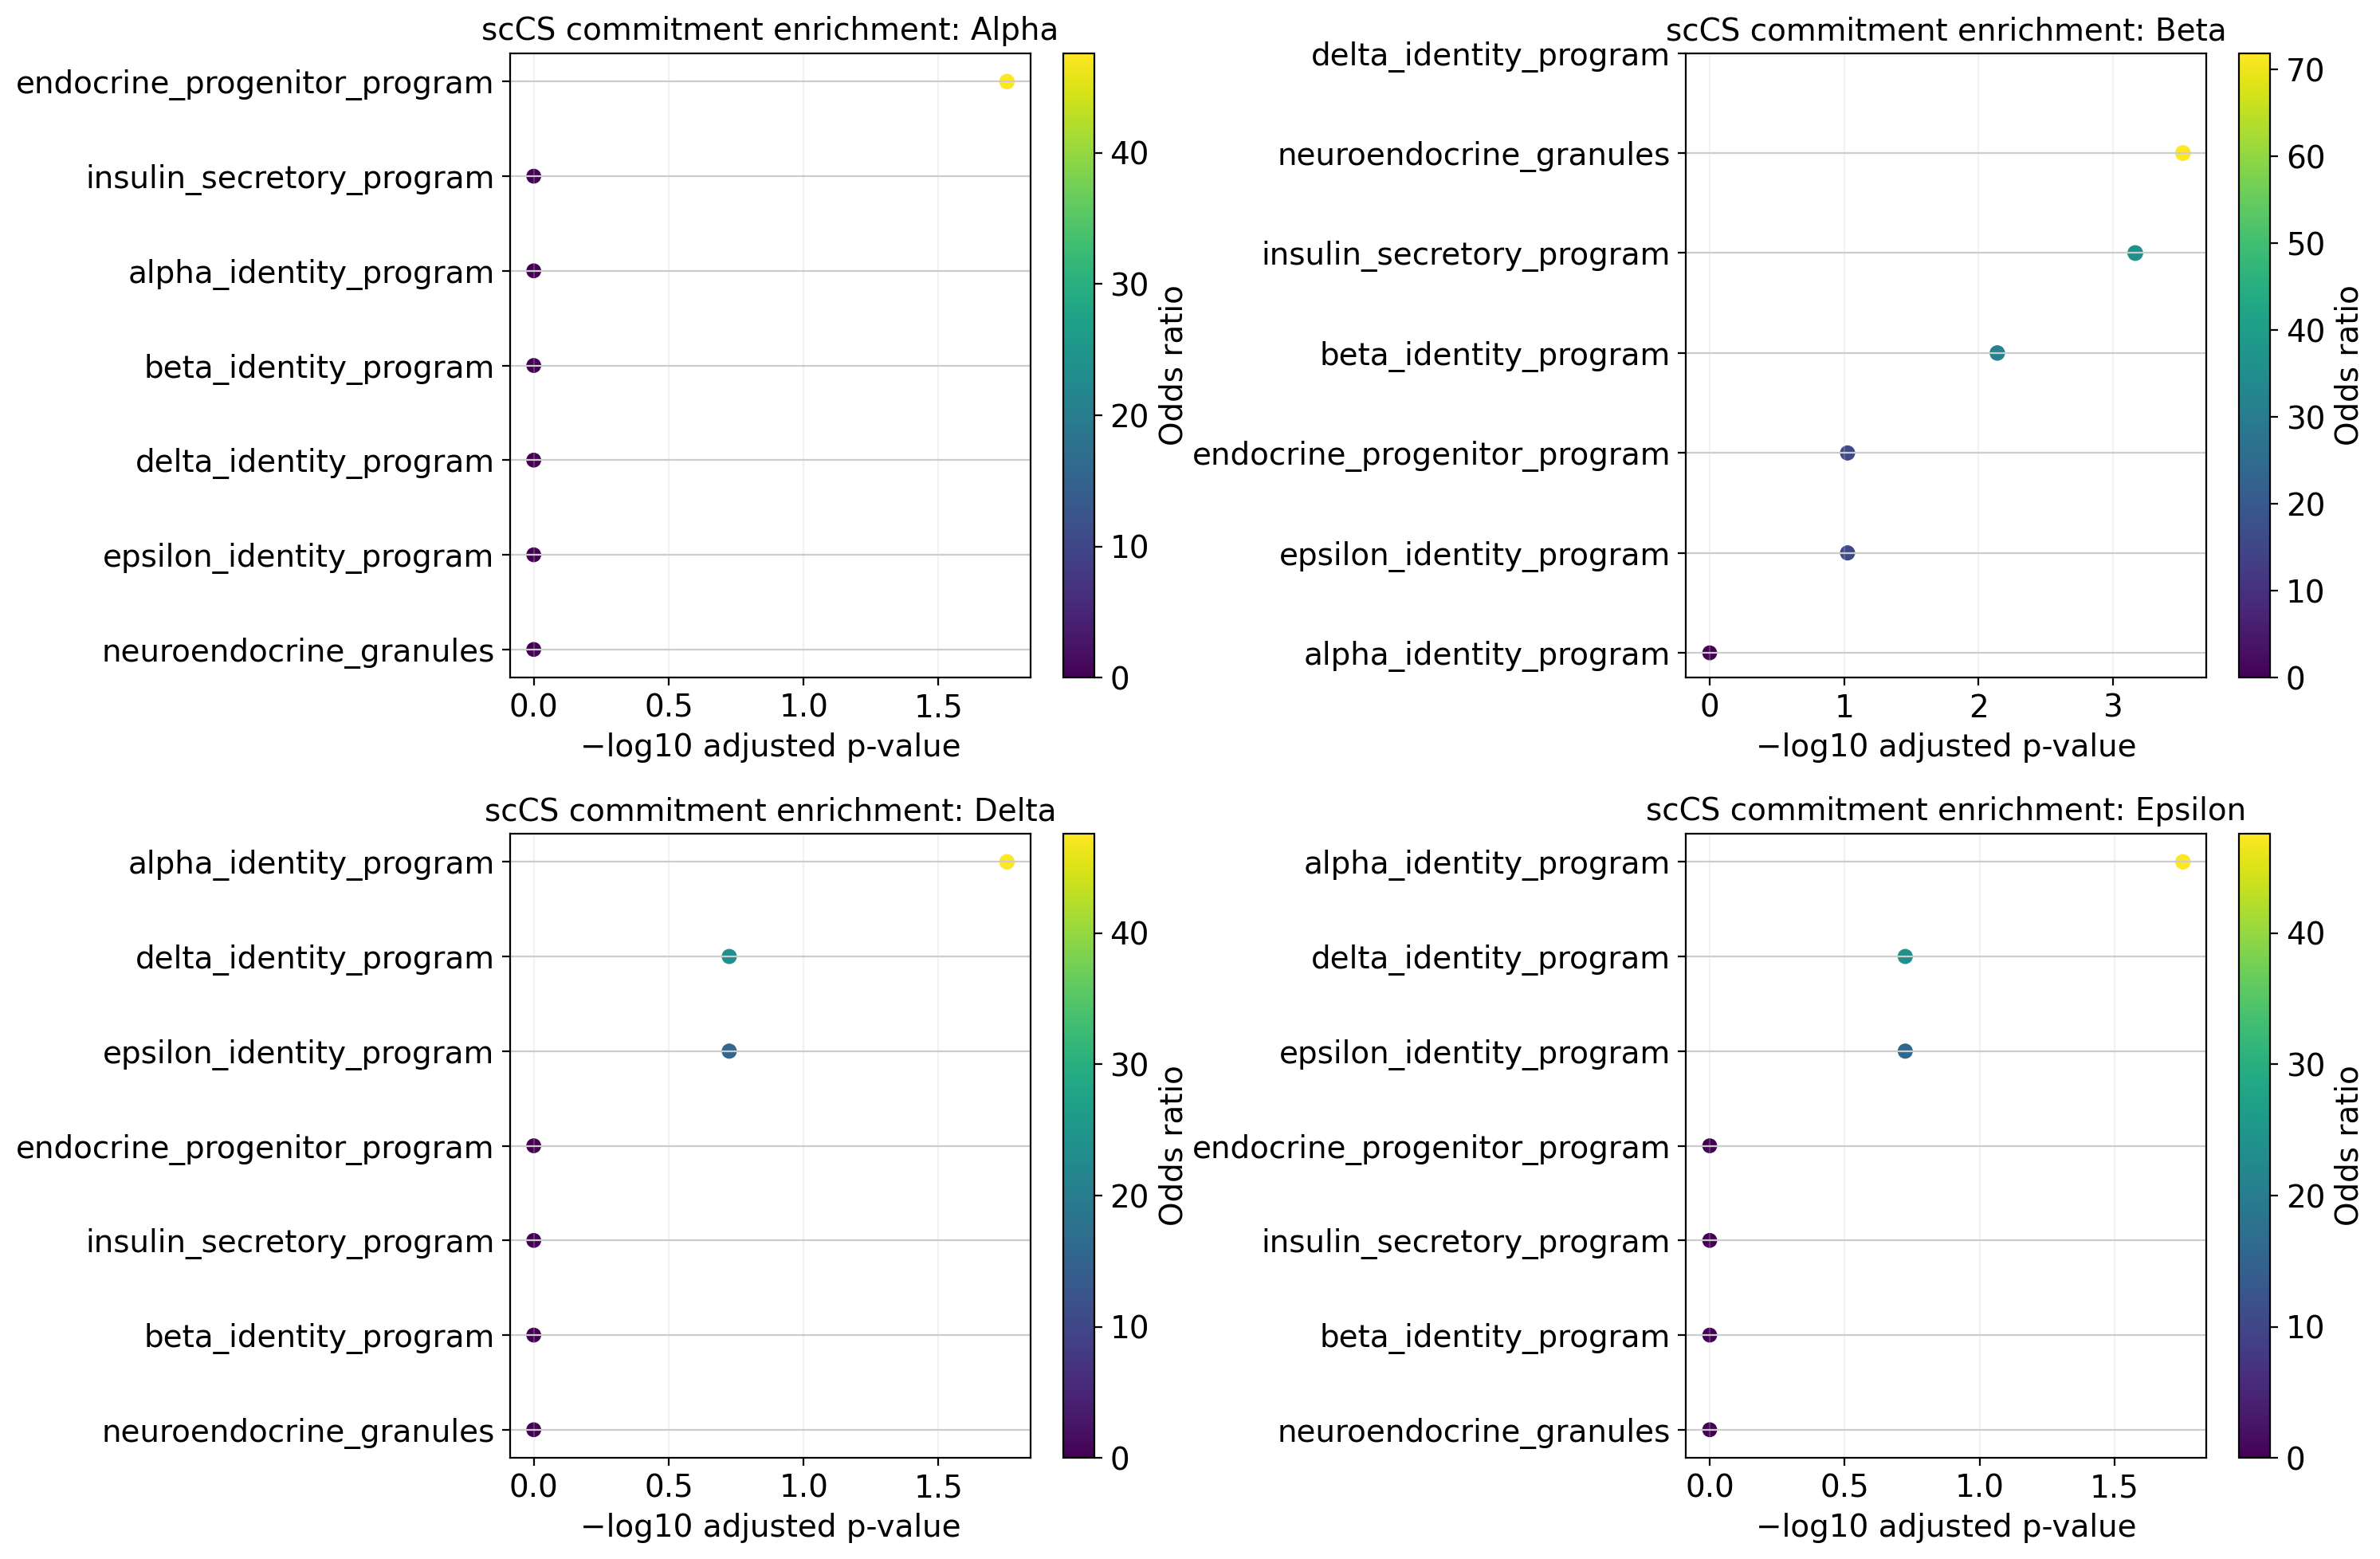
The tutorial uses a small local mouse endocrine gene-set mapping so the analysis is deterministic and does not depend on a changing remote database. For a publication, replace it with a versioned GMT file and an assay-specific background.
[15]:
local_gene_sets = {
    "endocrine_progenitor_program": {"Neurog3", "Neurod1", "Insm1", "Pax4", "Pax6"},
    "insulin_secretory_program": {"Ins1", "Ins2", "Iapp", "Pcsk1", "Pcsk2", "Chga", "Chgb"},
    "alpha_identity_program": {"Gcg", "Mafb", "Arx", "Ttr", "Slc7a2"},
    "beta_identity_program": {"Ins1", "Ins2", "Pdx1", "Nkx6-1", "Mafa", "Iapp"},
    "delta_identity_program": {"Sst", "Hhex", "Ghsr", "Rbp4", "Col25a1"},
    "epsilon_identity_program": {"Ghrl", "Irx2", "Tspan8", "Slc18a1", "Fev"},
    "neuroendocrine_granules": {"Chga", "Chgb", "Scg2", "Scg3", "Scg5", "Cpe"},
}
present = set(map(str, adata.var_names))
local_gene_sets = {
    term: sorted(set(genes) & present)
    for term, genes in local_gene_sets.items()
}
display(pd.Series({term: len(genes) for term, genes in local_gene_sets.items()}, name="n_genes"))
endocrine_progenitor_program    4
insulin_secretory_program       7
alpha_identity_program          4
beta_identity_program           5
delta_identity_program          3
epsilon_identity_program        4
neuroendocrine_granules         5
Name: n_genes, dtype: int64
[16]:
enrichment = scCS.run_commitment_enrichment(
    association,
    gene_sets=local_gene_sets,
    background=adata.var_names,
    direction="positive",
    effect_threshold=0.05,
    significant_only=False,
    max_genes=150,
    min_query_genes=3,
    min_set_size=3,
    fdr_threshold=0.10,
    verbose=True,
)
enrichment.export(OUTPUT_DIR, prefix="pancreas_local_enrichment")

fig, axes = plt.subplots(2, 2, figsize=(15, 10))
for axis, fate in zip(axes.ravel(), FATES):
    scCS.plot_enrichment_dotplot(
        enrichment,
        fate,
        n_terms=10,
        significant_only=False,
        ax=axis,
    )
fig.tight_layout()
fig.savefig(OUTPUT_DIR / "local_enrichment_dotplots.png", dpi=200, bbox_inches="tight")
plt.show()
[scCS] Enrichment Alpha: query_genes=150, significant_terms=1
[scCS] Enrichment Beta: query_genes=150, significant_terms=6
[scCS] Enrichment Delta: query_genes=150, significant_terms=1
[scCS] Enrichment Epsilon: query_genes=150, significant_terms=1
12. Subset summaries: early, middle, and late root
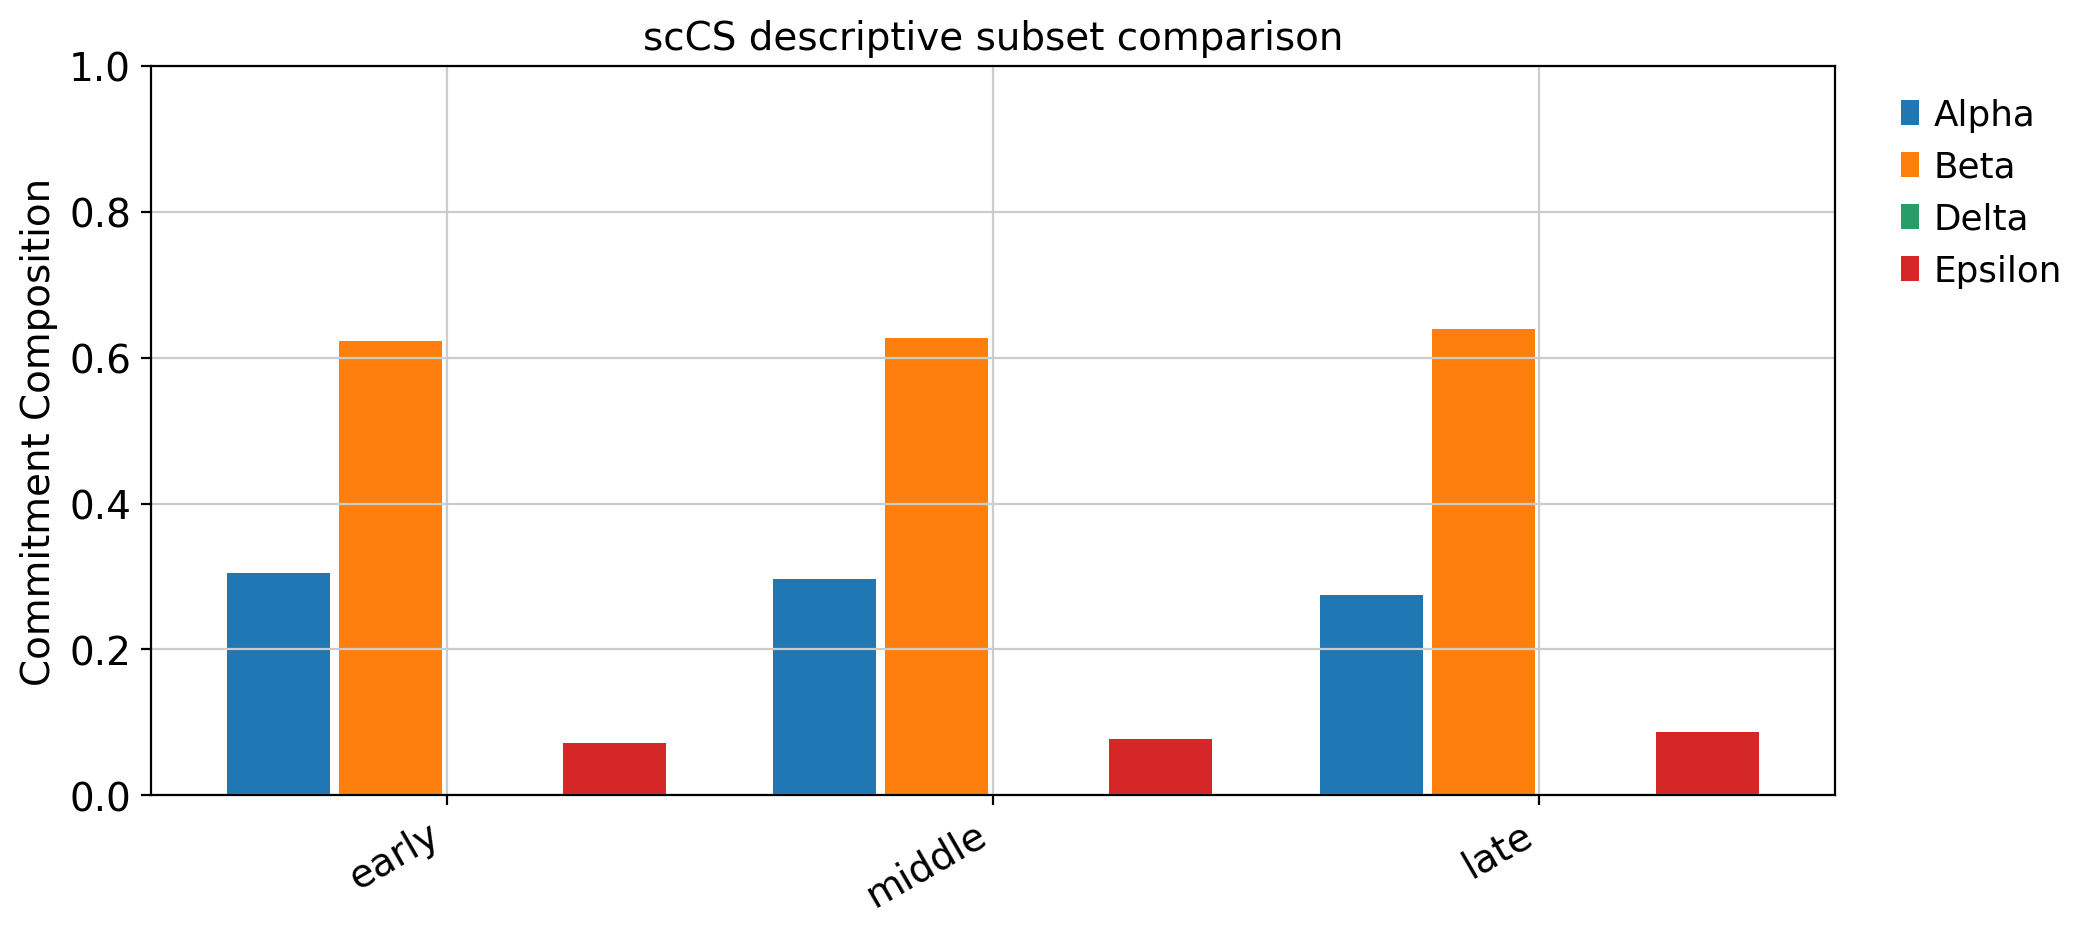
Subset comparisons can show how fate composition changes along the incoming path. They remain descriptive unless subsets correspond to independent biological replicate units.
[17]:
root_ids = result.cell_ids[result.root_mask]
root_ordering = pd.Series(
    adata.obs.loc[root_ids, ORDERING_KEY].to_numpy(float),
    index=root_ids,
)
third = pd.qcut(
    root_ordering.rank(method="first"),
    q=3,
    labels=["early", "middle", "late"],
)
subset_summaries = {}
for label in ["early", "middle", "late"]:
    mask = result.root_mask.copy()
    mask[result.root_mask] = third.to_numpy() == label
    subset_summaries[label] = result.summarize(mask)

subset_figure = scorer.plot_subset_comparison(
    subset_summaries,
    metric="commitment_composition",
)
subset_figure.savefig(
    OUTPUT_DIR / "root_ordering_thirds_composition.png",
    dpi=200,
    bbox_inches="tight",
)
plt.show()
13. Replicate-aware template for a real study
For a real multi-sample dataset, rerun the association with genuine biological replicate metadata:
association_replicate = scorer.get_commitment_associated_genes(
    outcome="future_fate_affinity",
    fate_names=FATES,
    population="root",
    inference_unit="replicate",
    replicate_key="sample_id",
    condition_key="condition",
    pseudotime_key=ORDERING_KEY,
    min_replicates=6,
    min_cells_per_replicate=5,
)
Do not construct pseudo-replicates for biological inference.
14. Export the complete downstream record
[18]:
summary_table.to_csv(OUTPUT_DIR / "cell_level_DFFP_metrics.csv", index=False)
adata.write_h5ad(OUTPUT_DIR / "pancreas_downstream_analysis.h5ad")

metadata = {
    "scoring_method": "Discounted Future-Fate Propagation",
    "scoring_mode": "future_fate",
    "velocity_model": "dynamical",
    "ordering_key": ORDERING_KEY,
    "effective_horizon": FUTURE_OPTIONS["effective_horizon"],
    "anchor_quantile": FUTURE_OPTIONS["anchor_quantile"],
    "association_scope": "cell_exploratory_candidate_generation",
    "enrichment_source": "local_in_notebook_mapping",
}
pd.Series(metadata).to_json(
    OUTPUT_DIR / "downstream_metadata.json",
    indent=2,
)
print("Outputs written to", OUTPUT_DIR.resolve())
Outputs written to /home/emil/notebooks/08-tutorials/tutorial_outputs/pancreas_downstream
Interpretation checklist
DFFP must be accepted before downstream screening.
Marker expression, commitment association, and terminal markers answer different questions.
Cell-level association is exploratory without biological replicates.
Local gene sets and the tested-gene background should be versioned.
Enrichment supports interpretation; it does not establish causal regulation.