scCS Tutorial — Multi-Condition Analysis with MultiScorer¶
This tutorial demonstrates MultiScorer — the scCS class for analyses with 3 or more conditions — on a real-data illustrative example: the scVelo pancreatic endocrinogenesis dataset stratified by per-cell RNA-velocity magnitude into three tertiles (low_velocity, med_velocity, high_velocity).
The velocity-tertile split is an illustrative stratification, not a biological perturbation. In a real experiment,
condition_obs_keywould point to actual experimental conditions (e.g.,drug,genotype,timepoint). The downstream patterns shown here — per-condition driver discovery, pathway enrichment, expression trends — work identically on real biological condition labels.
What’s covered¶
Loading pancreas data and creating the 3-way velocity-tertile split
Initializing
MultiScorerand fitting the shared embeddingTier 1 — Score all conditions on the shared embedding
Tier 2 — Omnibus tests (Kruskal-Wallis / ANOVA) + post-hoc pairwise comparisons
Tier 3 — Mixed-effects models with reference contrasts
Standard multi-condition visualizations
Driver genes per condition (velocity + DEG)
Pathway enrichment per condition
Expression trends along fate arms per condition
Transfer per-cell labels back to the full AnnData
For 2-condition comparisons use PairScorer (see scCS_tutorial_pairwise.ipynb).
[1]:
%matplotlib inline
import warnings, numpy as np, pandas as pd
import anndata as ad
import scanpy as sc, scvelo as scv
import matplotlib.pyplot as plt
import scCS

from scCS.drivers import (
    get_velocity_drivers,
    get_deg_drivers,
    get_velocity_fate_drivers,
)
from scCS.enrichment import run_enrichment_per_fate
from scCS.plot import plot_expression_trends

warnings.filterwarnings("ignore", category=DeprecationWarning)
warnings.filterwarnings("ignore", category=FutureWarning)
try:
    from statsmodels.tools.sm_exceptions import ConvergenceWarning
    warnings.filterwarnings("ignore", category=ConvergenceWarning)
except ImportError:
    pass
pd.set_option("display.max_rows", 25)
pd.set_option("display.max_columns", 15)
pd.set_option("display.width", 160)

print(f"scCS version: {scCS.__version__}")


# -------- compact display helpers for multi-condition tutorials --------
def _stack_drivers_by_condition(driver_dicts, n_per_fate=5, cols=None):
    """{cond: {fate: DataFrame}}  ->  one long table (condition, fate, ...)."""
    out = []
    for cond, fate_dict in driver_dicts.items():
        for fate, df in fate_dict.items():
            if df is None or len(df) == 0:
                continue
            block = df.head(n_per_fate).copy()
            block.insert(0, "fate", fate)
            block.insert(0, "condition", cond)
            out.append(block)
    if not out:
        return pd.DataFrame()
    big = pd.concat(out, ignore_index=True)
    if cols is not None:
        keep = ["condition", "fate"] + [c for c in cols if c in big.columns]
        big = big[keep]
    return big


def _stack_enrichment_by_condition(enrichment_dicts, n_per_group=3):
    """{cond: {fate: {direction: df}}}  ->  one long table."""
    rows = []
    for cond, fate_results in enrichment_dicts.items():
        for fate, dir_results in fate_results.items():
            for direction in ("up", "down"):
                df = dir_results.get(direction, None)
                if df is None or df.empty:
                    continue
                top = df.head(n_per_group).copy()
                top.insert(0, "direction", direction)
                top.insert(0, "fate", fate)
                top.insert(0, "condition", cond)
                rows.append(top)
    if not rows:
        return pd.DataFrame()
    return pd.concat(rows, ignore_index=True)


def _driver_overlap(per_cond_drivers, n_top=10, gene_col="gene"):
    """Build a fate x gene x condition presence matrix from {cond: {fate: df}}."""
    rows = []
    conds = list(per_cond_drivers.keys())
    if not conds:
        return pd.DataFrame()
    fates = list(next(iter(per_cond_drivers.values())).keys())
    for fate in fates:
        sets = {}
        for cond in conds:
            df = per_cond_drivers[cond].get(fate)
            if df is None or len(df) == 0 or gene_col not in df.columns:
                sets[cond] = set()
            else:
                sets[cond] = set(df.head(n_top)[gene_col].astype(str))
        all_genes = sorted(set.union(*sets.values())) if sets else []
        for g in all_genes:
            row = {"fate": fate, "gene": g}
            for cond in conds:
                row[cond] = g in sets[cond]
            row["n_conds"] = sum(row[c] for c in conds)
            row["shared_all"] = row["n_conds"] == len(conds)
            rows.append(row)
    return pd.DataFrame(rows)
scCS version: 0.7.4
1. Load pancreas data and build the 3-way velocity-tertile split¶
We use the same dataset as the pairwise tutorial (scvelo.datasets.pancreas) but split cells into three groups based on per-cell RNA-velocity magnitude tertiles instead of a median split. This gives us 3 conditions on which to exercise MultiScorer.
Note on velocity-tertile demo: the split is illustrative, not a real biological perturbation. Fates are imbalanced across tertiles (e.g., high-velocity cells are mostly Ngn3 progenitors with few terminal Alpha/Delta cells; low-velocity cells are mostly mature post-mitotic populations). Statistical tests below will pick up this structural difference. For a real condition variable (e.g., treatment, genotype) the tutorial code is identical.
[2]:
# Load pancreas + compute velocity
adata = scv.datasets.pancreas()
import inspect as _inspect
_fn_sig = _inspect.signature(scv.pp.filter_and_normalize).parameters
if "n_top_genes" in _fn_sig:
    scv.pp.filter_and_normalize(adata, min_shared_counts=20, n_top_genes=2000)
else:
    # scvelo builds without n_top_genes: do filter_and_normalize then HVG.
    # Use flavor="cell_ranger" not the default "seurat": seurat passes
    # int n_bins to pd.cut on log-dispersions which contain +/-inf for
    # low-mean genes — pandas >= 2.2 rejects this with ValueError.
    # cell_ranger uses explicit bin edges including +/-inf and is
    # robust across pandas/py versions (scCS changelog v0.7.4).
    scv.pp.filter_and_normalize(adata, min_shared_counts=20)
    sc.pp.highly_variable_genes(
        adata, n_top_genes=2000, subset=True, flavor="cell_ranger"
    )
sc.pp.neighbors(adata)
scv.pp.moments(adata, n_pcs=None, n_neighbors=None)

# We use mode="deterministic" here because it's fast (~5s) and avoids a
# known scvelo + numpy 1.25+ scalar-conversion issue with mode="stochastic".
# For the dynamical model (slower, ~5-10 min on pancreas) instead use:
#     scv.tl.recover_dynamics(adata)
#     scv.tl.velocity(adata, mode="dynamical")
scv.tl.velocity(adata, mode="deterministic")
scv.tl.velocity_graph(adata)
scv.tl.velocity_pseudotime(adata)

# Per-cell velocity magnitude (NaN-safe across genes)
velocity_matrix = adata.layers["velocity"]
vel_magnitude = np.sqrt(np.nanmean(velocity_matrix ** 2, axis=1))

# 3-way tertile split
t1, t2 = np.nanquantile(vel_magnitude, [1 / 3, 2 / 3])
adata.obs["condition"] = pd.cut(
    vel_magnitude,
    bins=[-np.inf, t1, t2, np.inf],
    labels=["low_velocity", "med_velocity", "high_velocity"],
).astype(str)

# Synthetic biological replicates (3 per condition) — for the mixed model later
rng = np.random.default_rng(42)
adata.obs["sample"] = [
    f"{cond}_rep{rng.integers(1, 4)}" for cond in adata.obs["condition"]
]

print(adata)
print("\nCondition counts:")
print(adata.obs["condition"].value_counts())
print("\nReplicates per condition:")
print(adata.obs.groupby("condition", observed=True)["sample"].nunique())
Filtered out 20801 genes that are detected 20 counts (shared).
Normalized count data: X, spliced, unspliced.
computing moments based on connectivities
    finished (0:00:00) --> added
    'Ms' and 'Mu', moments of un/spliced abundances (adata.layers)
computing velocities
    finished (0:00:00) --> added
    'velocity', velocity vectors for each individual cell (adata.layers)
computing velocity graph (using 1/24 cores)
/home/emil/miniforge3/envs/lab-py312/lib/python3.12/multiprocessing/popen_fork.py:66: DeprecationWarning: This process (pid=5066) is multi-threaded, use of fork() may lead to deadlocks in the child.
  self.pid = os.fork()
    finished (0:00:01) --> added
    'velocity_graph', sparse matrix with cosine correlations (adata.uns)
computing terminal states
    identified 3 regions of root cells and 2 regions of end points .
    finished (0:00:00) --> added
    'root_cells', root cells of Markov diffusion process (adata.obs)
    'end_points', end points of Markov diffusion process (adata.obs)
AnnData object with n_obs × n_vars = 3696 × 2000
    obs: 'clusters_coarse', 'clusters', 'S_score', 'G2M_score', 'initial_size_unspliced', 'initial_size_spliced', 'initial_size', 'n_counts', 'velocity_self_transition', 'root_cells', 'end_points', 'velocity_pseudotime', 'condition', 'sample'
    var: 'highly_variable_genes', 'gene_count_corr', 'highly_variable', 'means', 'dispersions', 'dispersions_norm', 'velocity_gamma', 'velocity_qreg_ratio', 'velocity_r2', 'velocity_genes'
    uns: 'clusters_coarse_colors', 'clusters_colors', 'day_colors', 'neighbors', 'pca', 'hvg', 'velocity_params', 'velocity_graph', 'velocity_graph_neg'
    obsm: 'X_pca', 'X_umap'
    layers: 'spliced', 'unspliced', 'Ms', 'Mu', 'velocity'
    obsp: 'distances', 'connectivities'

Condition counts:
condition
med_velocity     1232
high_velocity    1232
low_velocity     1232
Name: count, dtype: int64

Replicates per condition:
condition
high_velocity    3
low_velocity     3
med_velocity     3
Name: sample, dtype: int64
2. Initialize MultiScorer¶
MultiScorer requires >= 3 conditions (it raises a helpful error otherwise pointing to PairScorer if you pass exactly 2). The condition_obs_key points to the column we just built. Replicate handling for Tier 3 mixed-models uses replicate_key.
[3]:
mscorer = scCS.MultiScorer(
    adata,
    root="Ductal",
    branches=["Alpha", "Beta", "Delta", "Epsilon"],
    condition_obs_key="condition",
    obs_key="clusters",
)
print(mscorer)
print("\nConditions detected:", mscorer.conditions)
[scCS] MultiScorer initialized.
       Conditions (3): ['high_velocity', 'low_velocity', 'med_velocity']
       Root: 'Ductal', Branches: ['Alpha', 'Beta', 'Delta', 'Epsilon']
MultiScorer(root='Ductal', branches=['Alpha', 'Beta', 'Delta', 'Epsilon'], conditions=['high_velocity', 'low_velocity', 'med_velocity'], status='uninitialised')

Conditions detected: ['high_velocity', 'low_velocity', 'med_velocity']
4. Tier 1 — Score all conditions¶
Compute per-condition CS / nCS scores plus cell-level affinities and bootstrap CIs.
[5]:
results = mscorer.score_all_conditions(cell_level=True, n_bootstrap=200)

summary_rows = []
for cond, res in results.items():
    summary_rows.append({
        "condition": cond,
        "n_cells_in_fate": int(res.n_cells_per_fate.sum()),
        "unCS_alpha_beta": float(res.pairwise_unCS[res.fate_names.index("Alpha"), res.fate_names.index("Beta")])
                            if "Alpha" in res.fate_names and "Beta" in res.fate_names else np.nan,
        "nCS_alpha_beta": float(res.pairwise_nCS[res.fate_names.index("Alpha"), res.fate_names.index("Beta")])
                            if "Alpha" in res.fate_names and "Beta" in res.fate_names else np.nan,
    })
pd.DataFrame(summary_rows)
[scCS] Scoring condition: 'high_velocity' (633 cells)...
[scCS] Computing bootstrap CI (n=200)...
=== CommitmentScoreResult ===
  Fates (4): Alpha, Beta, Delta, Epsilon
  Dominant fate: Beta

  Entropy metrics:
    Population entropy:           0.7565  [aggregate velocity-mass balance]
    Mean cell entropy:            0.9892  [per-cell average, k-way]
    Per-fate cell entropy:
      Alpha: 0.8224
      Beta: 0.8109
      Delta: 0.7921
      Epsilon: 0.7915

  Commitment vector (normalized):
    Alpha: 0.0587
    Beta: 0.5826
    Delta: 0.0879
    Epsilon: 0.2708

  Pairwise nCS matrix:
            Alpha      Beta     Delta   Epsilon
Alpha    1.000000  1.880778  0.222604  1.336829
Beta     0.531695  1.000000  0.118357  0.710785
Delta    4.492291  8.449001  1.000000  6.005426
Epsilon  0.748039  1.406895  0.166516  1.000000

  Bootstrap 95% CI on nCS (n=200):
    CI low:
         Alpha   Beta  Delta  Epsilon
Alpha    1.000  1.075  0.131    0.789
Beta     0.307  1.000  0.078    0.437
Delta    2.378  5.225  1.000    3.403
Epsilon  0.399  0.918  0.109    1.000
    CI high:
         Alpha    Beta  Delta  Epsilon
Alpha    1.000   3.261  0.421    2.508
Beta     0.930   1.000  0.191    1.090
Delta    7.653  12.820  1.000    9.162
Epsilon  1.268   2.286  0.294    1.000

[scCS] Scoring condition: 'low_velocity' (957 cells)...
[scCS] Computing bootstrap CI (n=200)...
=== CommitmentScoreResult ===
  Fates (4): Alpha, Beta, Delta, Epsilon
  Dominant fate: Alpha

  Entropy metrics:
    Population entropy:           0.8330  [aggregate velocity-mass balance]
    Mean cell entropy:            0.9892  [per-cell average, k-way]
    Per-fate cell entropy:
      Alpha: 0.8224
      Beta: 0.8109
      Delta: 0.7921
      Epsilon: 0.7915

  Commitment vector (normalized):
    Alpha: 0.4174
    Beta: 0.2902
    Delta: 0.0195
    Epsilon: 0.2729

  Pairwise nCS matrix:
            Alpha      Beta      Delta   Epsilon
Alpha    1.000000  1.315927   2.947273  0.273116
Beta     0.759921  1.000000   2.239694  0.207547
Delta    0.339297  0.446490   1.000000  0.092667
Epsilon  3.661447  4.818195  10.791283  1.000000

  Bootstrap 95% CI on nCS (n=200):
    CI low:
         Alpha   Beta  Delta  Epsilon
Alpha    1.000  1.072  1.955    0.208
Beta     0.578  1.000  1.496    0.156
Delta    0.198  0.277  1.000    0.056
Epsilon  2.701  3.384  6.932    1.000
    CI high:
         Alpha   Beta   Delta  Epsilon
Alpha    1.000  1.729   5.042    0.370
Beta     0.933  1.000   3.605    0.295
Delta    0.512  0.669   1.000    0.144
Epsilon  4.812  6.418  17.811    1.000

[scCS] Scoring condition: 'med_velocity' (610 cells)...
[scCS] Computing bootstrap CI (n=200)...
=== CommitmentScoreResult ===
  Fates (4): Alpha, Beta, Delta, Epsilon
  Dominant fate: Beta

  Entropy metrics:
    Population entropy:           0.8042  [aggregate velocity-mass balance]
    Mean cell entropy:            0.9892  [per-cell average, k-way]
    Per-fate cell entropy:
      Alpha: 0.8224
      Beta: 0.8109
      Delta: 0.7921
      Epsilon: 0.7915

  Commitment vector (normalized):
    Alpha: 0.2271
    Beta: 0.5552
    Delta: 0.0520
    Epsilon: 0.1657

  Pairwise nCS matrix:
            Alpha      Beta     Delta   Epsilon
Alpha    1.000000  0.538022  0.708432  0.493838
Beta     1.858660  1.000000  1.316734  0.917876
Delta    1.411568  0.759455  1.000000  0.697085
Epsilon  2.024957  1.089471  1.434545  1.000000

  Bootstrap 95% CI on nCS (n=200):
    CI low:
         Alpha   Beta  Delta  Epsilon
Alpha    1.000  0.381  0.452    0.294
Beta     1.280  1.000  0.838    0.586
Delta    0.881  0.469  1.000    0.402
Epsilon  1.273  0.689  0.795    1.000
    CI high:
         Alpha   Beta  Delta  Epsilon
Alpha    1.000  0.781  1.136    0.785
Beta     2.623  1.000  2.134    1.451
Delta    2.213  1.194  1.000    1.259
Epsilon  3.398  1.705  2.485    1.000
[5]:
| condition | n_cells_in_fate | unCS_alpha_beta | nCS_alpha_beta | |
|---|---|---|---|---|
| 0 | high_velocity | 157 | 0.100756 | 1.880778 |
| 1 | low_velocity | 812 | 1.438430 | 1.315927 |
| 2 | med_velocity | 315 | 0.409044 | 0.538022 |
5. Tier 2 — Omnibus tests¶
Test whether per-cell affinity scores differ across all conditions simultaneously, fate by fate.
Kruskal-Wallis (default): non-parametric, doesn’t assume normality.
ANOVA: parametric, faster.
[6]:
omnibus_df = mscorer.compare_omnibus(results, test="kruskal")
omnibus_df
=== Omnibus test (kruskal) across 3 conditions ===
  Significant fates: 4 / 4
   fate           test  statistic         pval     pval_adj  significant
  Alpha kruskal-wallis 156.075014 1.284521e-34 5.138084e-34         True
   Beta kruskal-wallis  16.778824 2.272609e-04 9.090435e-04         True
  Delta kruskal-wallis 156.910776 8.457808e-35 3.383123e-34         True
Epsilon kruskal-wallis  15.441959 4.434260e-04 1.773704e-03         True
[6]:
| fate | test | statistic | pval | n_conditions | pval_adj | significant | |
|---|---|---|---|---|---|---|---|
| 0 | Alpha | kruskal-wallis | 156.075014 | 1.284521e-34 | 3 | 5.138084e-34 | True |
| 1 | Beta | kruskal-wallis | 16.778824 | 2.272609e-04 | 3 | 9.090435e-04 | True |
| 2 | Delta | kruskal-wallis | 156.910776 | 8.457808e-35 | 3 | 3.383123e-34 | True |
| 3 | Epsilon | kruskal-wallis | 15.441959 | 4.434260e-04 | 3 | 1.773704e-03 | True |
6. Tier 2 — Post-hoc pairwise comparisons¶
When the omnibus rejects H0, follow up with pairwise post-hoc tests.
dunn: standard non-parametric post-hoc for Kruskal-Wallis (Bonferroni-corrected).tukey: standard parametric post-hoc for ANOVA.mwu: Mann-Whitney U for each pair, Bonferroni-corrected.
Pass omnibus_results= to restrict post-hoc to fates that passed omnibus.
[7]:
posthoc_df = mscorer.compare_posthoc(
    results,
    omnibus_results=omnibus_df,
    method="dunn",
    pval_correction="bonferroni",
    pval_threshold=0.05,
)
posthoc_df
=== Post-hoc comparison (dunn, correction=bonferroni) ===
  Significant pairs: 6 / 12
   fate                    comparison method         pval     pval_adj  delta_mean
  Alpha high_velocity vs low_velocity   dunn 1.158355e-29 1.390026e-28   -0.018806
  Alpha  low_velocity vs med_velocity   dunn 1.069279e-20 1.283135e-19    0.014005
   Beta high_velocity vs low_velocity   dunn 5.344060e-05 6.412872e-04    0.001263
  Delta high_velocity vs low_velocity   dunn 6.652264e-30 7.982717e-29    0.018908
  Delta  low_velocity vs med_velocity   dunn 1.109400e-20 1.331281e-19   -0.014062
Epsilon high_velocity vs low_velocity   dunn 1.048553e-04 1.258264e-03   -0.001364
[7]:
| fate | comparison | method | statistic | pval | mean_A | mean_B | delta_mean | pval_adj | significant | |
|---|---|---|---|---|---|---|---|---|---|---|
| 0 | Alpha | high_velocity vs low_velocity | dunn | NaN | 1.158355e-29 | 0.249787 | 0.268593 | -0.018806 | 1.390026e-28 | True |
| 1 | Alpha | high_velocity vs med_velocity | dunn | NaN | 9.014552e-02 | 0.249787 | 0.254588 | -0.004801 | 1.000000e+00 | False |
| 2 | Alpha | low_velocity vs med_velocity | dunn | NaN | 1.069279e-20 | 0.268593 | 0.254588 | 0.014005 | 1.283135e-19 | True |
| 3 | Beta | high_velocity vs low_velocity | dunn | NaN | 5.344060e-05 | 0.254747 | 0.253484 | 0.001263 | 6.412872e-04 | True |
| 4 | Beta | high_velocity vs med_velocity | dunn | NaN | 1.034544e-01 | 0.254747 | 0.260941 | -0.006195 | 1.000000e+00 | False |
| 5 | Beta | low_velocity vs med_velocity | dunn | NaN | 2.698207e-02 | 0.253484 | 0.260941 | -0.007458 | 3.237848e-01 | False |
| 6 | Delta | high_velocity vs low_velocity | dunn | NaN | 6.652264e-30 | 0.250201 | 0.231294 | 0.018908 | 7.982717e-29 | True |
| 7 | Delta | high_velocity vs med_velocity | dunn | NaN | 8.150100e-02 | 0.250201 | 0.245356 | 0.004845 | 9.780120e-01 | False |
| 8 | Delta | low_velocity vs med_velocity | dunn | NaN | 1.109400e-20 | 0.231294 | 0.245356 | -0.014062 | 1.331281e-19 | True |
| 9 | Epsilon | high_velocity vs low_velocity | dunn | NaN | 1.048553e-04 | 0.245265 | 0.246630 | -0.001364 | 1.258264e-03 | True |
| 10 | Epsilon | high_velocity vs med_velocity | dunn | NaN | 1.139209e-01 | 0.245265 | 0.239115 | 0.006151 | 1.000000e+00 | False |
| 11 | Epsilon | low_velocity vs med_velocity | dunn | NaN | 3.532275e-02 | 0.246630 | 0.239115 | 0.007515 | 4.238730e-01 | False |
7. Compute pairwise deltas (ΔnCS) for all condition pairs¶
[8]:
deltas = mscorer.compute_pairwise_deltas(n_bootstrap=100, verbose=False)

delta_rows = []
for (cond_a, cond_b), delta in deltas.items():
    fate_names_d = delta["fate_names"]
    k = len(fate_names_d)
    for i in range(k):
        for j in range(i + 1, k):
            delta_rows.append({
                "cond_a": cond_a,
                "cond_b": cond_b,
                "fate_pair": f"{fate_names_d[i]} vs {fate_names_d[j]}",
                "delta_nCS": float(delta["delta_nCS"][i, j]),
                "CI_low":    float(delta["ci_low"][i, j]),
                "CI_high":   float(delta["ci_high"][i, j]),
            })
pd.DataFrame(delta_rows)
[8]:
| cond_a | cond_b | fate_pair | delta_nCS | CI_low | CI_high | |
|---|---|---|---|---|---|---|
| 0 | high_velocity | low_velocity | Alpha vs Beta | 0.564851 | -0.051601 | 1.366215 |
| 1 | high_velocity | low_velocity | Alpha vs Delta | -2.724670 | -4.147149 | -2.035804 |
| 2 | high_velocity | low_velocity | Alpha vs Epsilon | 1.063713 | 0.607047 | 1.774658 |
| 3 | high_velocity | low_velocity | Beta vs Delta | -2.121337 | -3.143616 | -1.511814 |
| 4 | high_velocity | low_velocity | Beta vs Epsilon | 0.503239 | 0.288870 | 0.789858 |
| 5 | high_velocity | low_velocity | Delta vs Epsilon | 5.912758 | 3.766956 | 8.101832 |
| 6 | high_velocity | med_velocity | Alpha vs Beta | 1.342756 | 0.683284 | 2.208189 |
| 7 | high_velocity | med_velocity | Alpha vs Delta | -0.485829 | -0.736719 | -0.216908 |
| 8 | high_velocity | med_velocity | Alpha vs Epsilon | 0.842992 | 0.318774 | 1.503781 |
| 9 | high_velocity | med_velocity | Beta vs Delta | -1.198377 | -1.632024 | -0.819982 |
| 10 | high_velocity | med_velocity | Beta vs Epsilon | -0.207091 | -0.743554 | 0.246893 |
| 11 | high_velocity | med_velocity | Delta vs Epsilon | 5.308340 | 3.154044 | 7.473284 |
| 12 | low_velocity | med_velocity | Alpha vs Beta | 0.777905 | 0.590668 | 1.079409 |
| 13 | low_velocity | med_velocity | Alpha vs Delta | 2.238841 | 1.541933 | 3.886388 |
| 14 | low_velocity | med_velocity | Alpha vs Epsilon | -0.220722 | -0.505912 | -0.038625 |
| 15 | low_velocity | med_velocity | Beta vs Delta | 0.922960 | 0.221573 | 2.134772 |
| 16 | low_velocity | med_velocity | Beta vs Epsilon | -0.710330 | -1.164860 | -0.390430 |
| 17 | low_velocity | med_velocity | Delta vs Epsilon | -0.604418 | -1.061001 | -0.396445 |
8. Tier 3 — Mixed-effects model with reference contrasts¶
Fits per-cell affinity ~ condition + (1 | replicate), with one of the conditions as the reference. Returns coefficient estimates for each non-reference condition.
[9]:
contrasts_df = mscorer.fit_mixed_model_contrasts(
    results,
    ref_condition="low_velocity",
    replicate_key="sample",
)
contrasts_df.head(20)
=== Mixed-effects model contrasts ===
  Significant contrasts: 0 / 8
[9]:
| fate | contrast | condition_a | condition_b | coef | std_err | z_score | pval | pval_adj | significant | |
|---|---|---|---|---|---|---|---|---|---|---|
| 0 | Alpha | high_velocity vs low_velocity | high_velocity | low_velocity | 0.487261 | NaN | 0.0 | 1.0 | 1.0 | False |
| 1 | Alpha | med_velocity vs low_velocity | med_velocity | low_velocity | 0.370473 | NaN | 0.0 | 1.0 | 1.0 | False |
| 2 | Beta | high_velocity vs low_velocity | high_velocity | low_velocity | 1.327102 | NaN | 0.0 | 1.0 | 1.0 | False |
| 3 | Beta | med_velocity vs low_velocity | med_velocity | low_velocity | -0.213693 | NaN | 0.0 | 1.0 | 1.0 | False |
| 4 | Delta | high_velocity vs low_velocity | high_velocity | low_velocity | -0.042396 | NaN | 0.0 | 1.0 | 1.0 | False |
| 5 | Delta | med_velocity vs low_velocity | med_velocity | low_velocity | 0.249594 | NaN | 0.0 | 1.0 | 1.0 | False |
| 6 | Epsilon | high_velocity vs low_velocity | high_velocity | low_velocity | -2.542953 | NaN | 0.0 | 1.0 | 1.0 | False |
| 7 | Epsilon | med_velocity vs low_velocity | med_velocity | low_velocity | 0.172580 | NaN | 0.0 | 1.0 | 1.0 | False |
9. Visualizations¶
[10]:
# Omnibus summary: fates x conditions heatmap (also marks post-hoc significance)
fig = mscorer.plot_omnibus_summary(omnibus_df, results, posthoc_df=posthoc_df)
fig.savefig("multi_omnibus_summary.png", dpi=120, bbox_inches="tight")
plt.show()
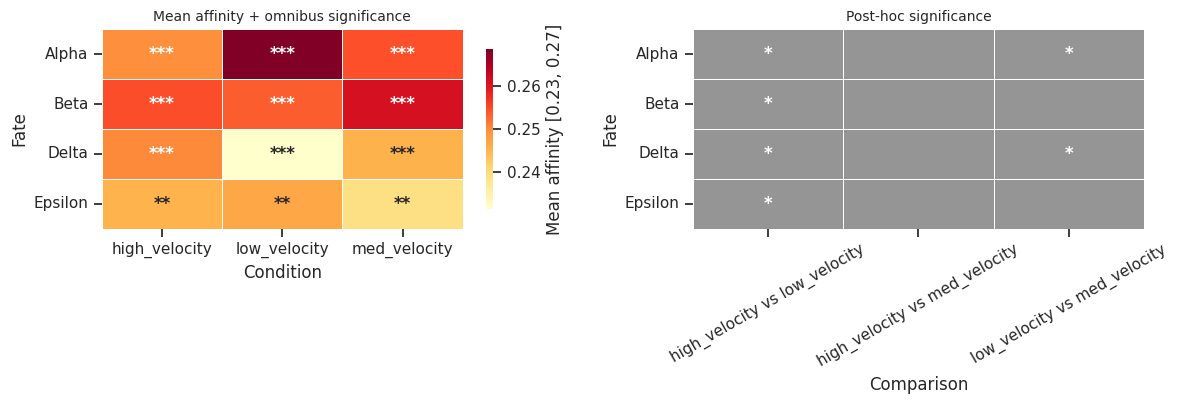
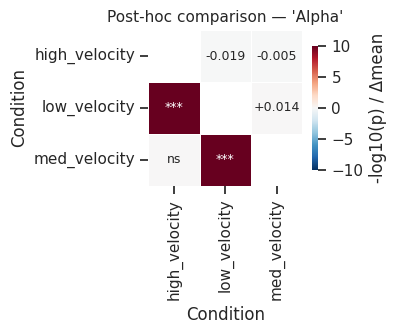
[11]:
# Per-fate post-hoc heatmap (shows which condition pairs differ)
fig = mscorer.plot_posthoc_heatmap(posthoc_df)
fig.savefig("multi_posthoc_heatmap.png", dpi=120, bbox_inches="tight")
plt.show()
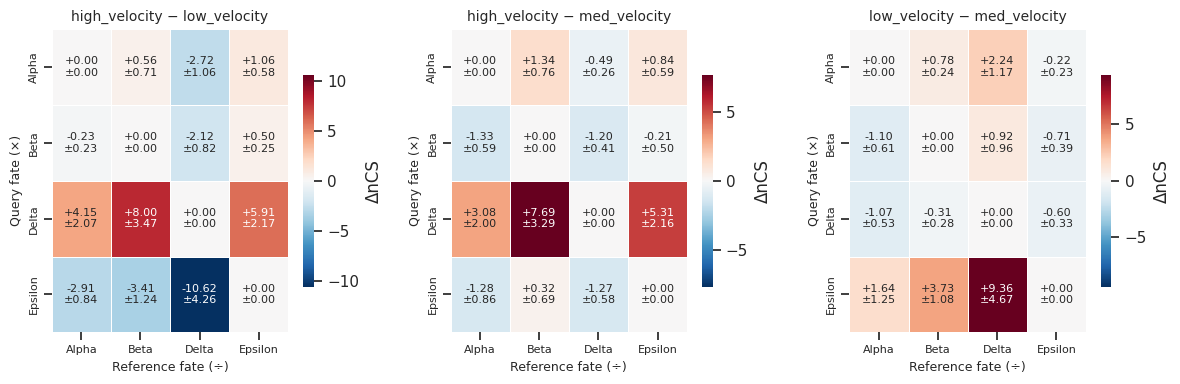
[12]:
# Pairwise delta grid: ΔCS heatmaps for all condition pairs
fig = mscorer.plot_pairwise_delta_grid(deltas)
fig.savefig("multi_pairwise_deltas.png", dpi=120, bbox_inches="tight")
plt.show()
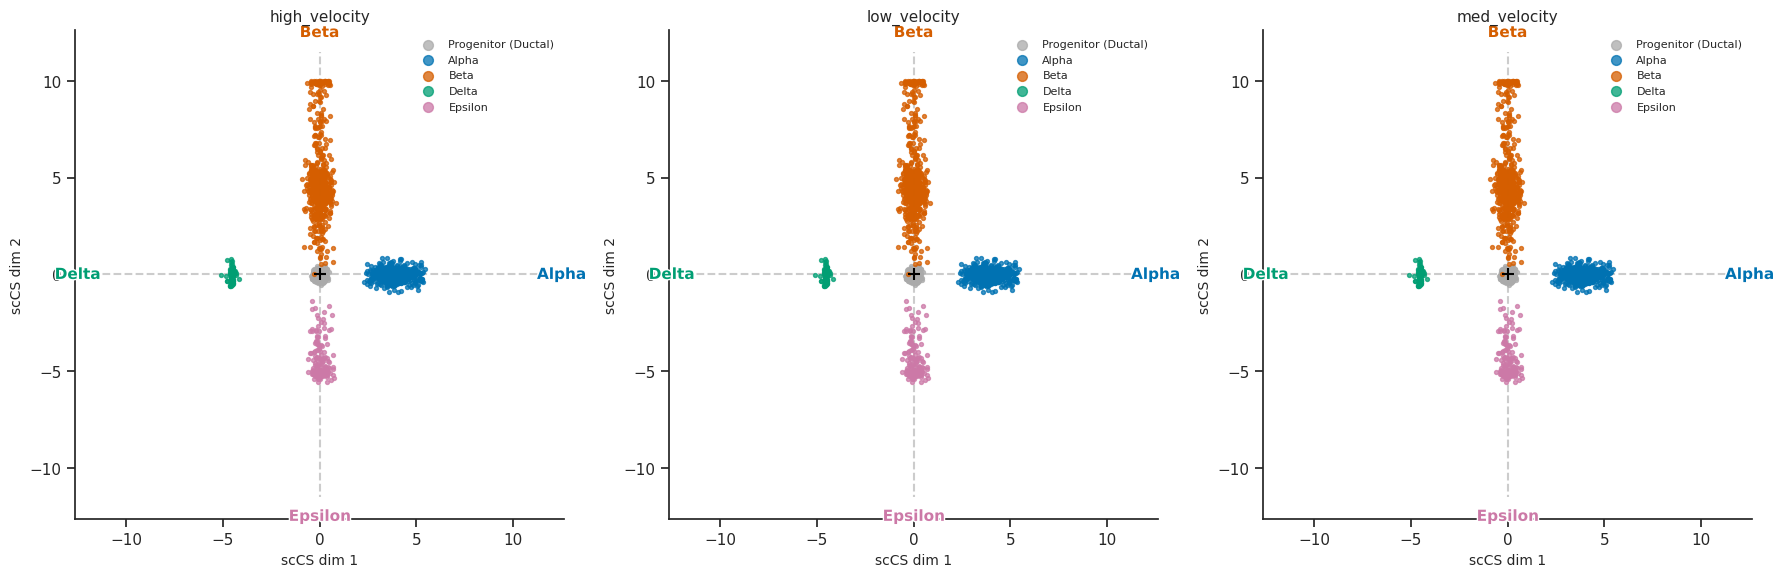
[13]:
# Standard multi-condition visualizations (shared with PairScorer)
fig = mscorer.plot_star_grid(results)
plt.show()
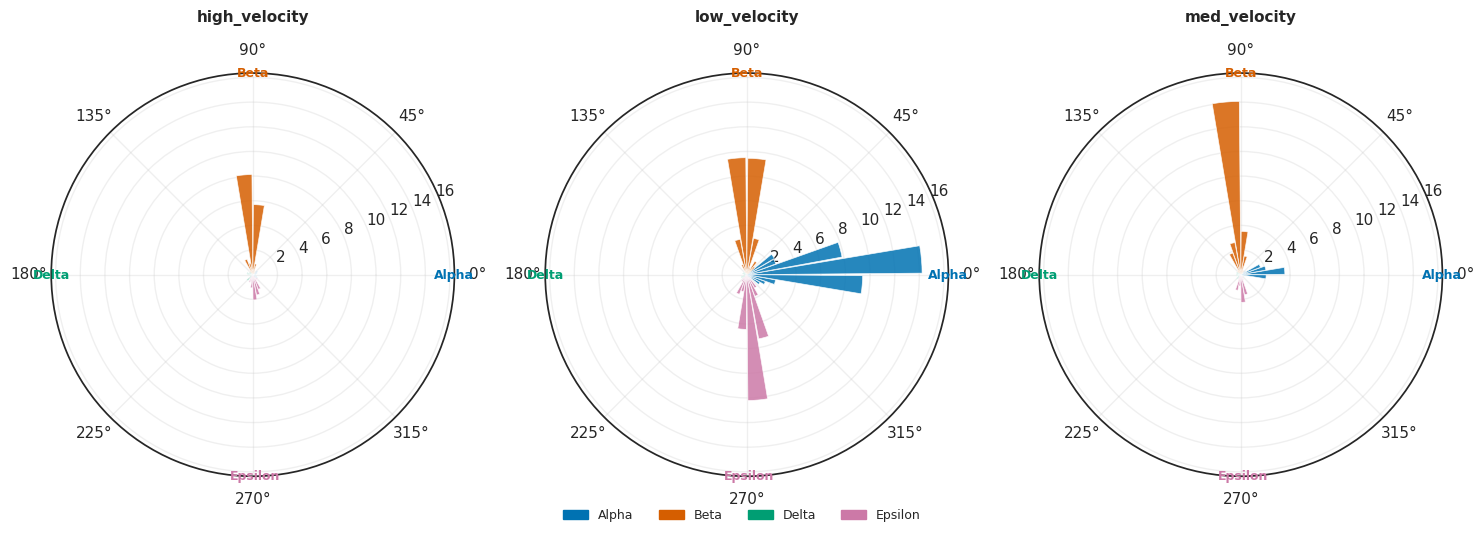
fig = mscorer.plot_rose_grid(results)
plt.show()
10. Driver genes per condition¶
For each condition we mask the shared embedding’s adata_sub to that condition, then run the same drivers used in SingleScorer — get_velocity_drivers and get_deg_drivers. The compact _stack_drivers_by_condition helper concatenates the per-fate results into one tidy (condition, fate, gene, ...) table.
This pattern lets you ask:
“Which genes drive each fate decisionwithineach condition?”
“Which driver genes aresharedacross all conditions vscondition-specific?”
[14]:
adata_sub_shared = mscorer._scorer.adata_sub
fate_names = mscorer._scorer._fate_map.fate_names
root_cluster = mscorer._scorer.root
obs_key_used = mscorer._scorer.obs_key

vel_drivers_per_cond = {}
for cond in mscorer.conditions:
    mask = (adata_sub_shared.obs[mscorer.condition_obs_key].astype(str) == cond).values
    sub = adata_sub_shared[mask].copy()
    vel_drivers_per_cond[cond] = get_velocity_drivers(
        sub,
        fate_names=fate_names,
        obs_key=obs_key_used,
        root=root_cluster,
        n_top_genes=20,
    )

# One compact table: (condition, fate, gene, delta_velocity, mean_velocity, rank)
print("Top velocity drivers (top 5 per fate, per condition):")
_stack_drivers_by_condition(
    vel_drivers_per_cond,
    n_per_fate=5,
    cols=["gene", "delta_velocity", "mean_velocity", "rank"],
)
── Velocity drivers: Alpha (top 20, sorted by delta_velocity) ──
 rank     gene  delta_velocity  mean_velocity
    1   Ptprn2       10.138916      10.179033
    2   Hs6st3        3.034873       3.104659
    3  Fam155a        2.228252       2.250724
    4     Rora        1.744673       1.288695
    5   Kcnma1        1.205779       1.199826
    6    Ndst4        1.142244       1.151202
    7  Stxbp5l        1.115459       1.149110
    8    Glud1        1.078897       0.986085
    9   Dock11        1.037627       1.048391
   10    Rims2        0.969603       1.035052
   11    Kcnb2        0.855988       0.901875
   12      Tnr        0.838274       0.840978
   13    Nlgn1        0.813350       0.828963
   14  Cacna1d        0.786799       0.842683
   15  Cacna1a        0.772174       0.479498
   16 Tmem178b        0.724432       0.726721
   17    Meis2        0.640396       1.320285
   18     Rgs7        0.633256       0.633126
   19    Unc79        0.553534       0.561987
   20    Gnao1        0.547504       0.557490

── Velocity drivers: Beta (top 20, sorted by delta_velocity) ──
 rank    gene  delta_velocity  mean_velocity
    1  Ptprn2        3.382511       3.422628
    2    Rora        2.651336       2.195358
    3    Ins2        1.267590       1.869774
    4  Hs6st3        1.112840       1.182626
    5 Fam155a        0.823156       0.845628
    6   Sntg1        0.803178       0.959989
    7  Kcnmb2        0.722441       0.731022
    8   Rims2        0.625068       0.690516
    9    Gnas        0.566056       0.370796
   10   Gnao1        0.533264       0.543250
   11 Tmem108        0.484175       0.502514
   12     Cpe        0.482112       0.480504
   13 Phactr1        0.474257       0.432363
   14    Pax6        0.409636       0.406289
   15   Unc5c        0.385509       0.392267
   16   Map1b        0.382621       0.384673
   17  Rnf220        0.329072      -0.704068
   18    Rfx6        0.316811       0.337776
   19    Pim2        0.312921       0.318306
   20 Macrod2        0.312186       0.852050

── Velocity drivers: Delta (top 20, sorted by delta_velocity) ──
 rank     gene  delta_velocity  mean_velocity
    1   Hs6st3        2.518699       2.588486
    2  Fam155a        2.233560       2.256033
    3  Macrod2        1.641149       2.181014
    4  Stxbp5l        1.554508       1.588159
    5  Pip5k1b        1.302159       1.617899
    6    Pcsk2        1.195035       1.186527
    7      Ghr        1.095726       1.105962
    8    Prkca        1.086828       1.211758
    9 Slc16a12        0.868062       0.982354
   10     Sdk1        0.794813       0.840292
   11    Abcc8        0.771486       0.795749
   12    Unc79        0.697671       0.706124
   13   Ctnna3        0.692108       0.699166
   14    Gnao1        0.668201       0.678187
   15   Fbxl17        0.657306       1.152713
   16     Nol4        0.630128       0.639353
   17    Ptprt        0.620964       0.676163
   18  Cacna1d        0.606272       0.662156
   19  Cacna1a        0.588065       0.295389
   20    Tshz3        0.571219       0.568317

── Velocity drivers: Epsilon (top 20, sorted by delta_velocity) ──
 rank          gene  delta_velocity  mean_velocity
    1        Ptprn2        7.266768       7.306885
    2       Cacna1c        4.574422       4.559257
    3 9030622O22Rik        3.141153       3.523523
    4       Cacna1a        2.290157       1.997480
    5         Maml3        2.246315       2.489925
    6         Cadps        2.023596       2.027040
    7          Ghrl        1.524408       1.524595
    8       Rapgef4        1.362765       1.443573
    9           Pam        1.338101       1.679233
   10           Ghr        1.154232       1.164467
   11        Sorcs1        1.091565       1.137015
   12       Runx1t1        0.970272       0.964474
   13        Rimbp2        0.893447       0.889542
   14         Pard3        0.851990       0.369684
   15        Kcnma1        0.826091       0.820138
   16        Setbp1        0.775604       0.874517
   17       Slc7a14        0.755812       0.751685
   18         Gstz1        0.730673       0.386536
   19         Gnao1        0.694398       0.704384
   20         Kcnd2        0.670332       0.675399

── Velocity drivers: Alpha (top 20, sorted by delta_velocity) ──
 rank     gene  delta_velocity  mean_velocity
    1   Ptprn2        4.946443       5.012487
    2   Hs6st3        1.900544       1.959349
    3    Auts2        1.824287       2.177465
    4    Park2        1.416998       1.663597
    5  Fam155a        0.830096       0.837425
    6  Cacna1a        0.823989       0.444519
    7  Zcchc16        0.746371       0.767187
    8    Gnao1        0.719144       0.711517
    9    Rims2        0.706261       0.827242
   10  Macrod2        0.656080       0.851456
   11    Kctd8        0.563886       0.565218
   12    Chrm3        0.547148       0.611220
   13   Kcnma1        0.544609       0.545178
   14     Sdk1        0.512390       0.524567
   15    Unc79        0.459880       0.419348
   16 Tmem178b        0.441969       0.445359
   17  Cacna1c        0.429449       0.458596
   18    Nlgn1        0.424375       0.445873
   19   Sorcs1        0.412837       0.428996
   20    Pcsk2        0.385351       0.388765

── Velocity drivers: Beta (top 20, sorted by delta_velocity) ──
 rank    gene  delta_velocity  mean_velocity
    1  Hs6st3        2.056397       2.115201
    2  Ptprn2        1.646501       1.712545
    3    Ins2        1.640553       2.172913
    4    Nnat        1.464386       1.480304
    5   Park2        1.388878       1.635477
    6   Abcc8        1.196749       1.221476
    7    Rora        1.107728       0.719490
    8   Gnao1        1.025234       1.017608
    9   Cadps        0.882353       0.916004
   10    Sdk1        0.736400       0.748576
   11 Fam155a        0.674569       0.681898
   12   Gng12        0.656559       0.699961
   13   Maml3        0.639099       0.987928
   14 Cacna1a        0.638900       0.259430
   15 Tmem108        0.574204       0.578854
   16 Macrod2        0.551186       0.746562
   17   Rims2        0.535604       0.656585
   18   Unc5c        0.514555       0.520736
   19  Kcnmb2        0.464552       0.466642
   20   Unc79        0.440983       0.400451

── Velocity drivers: Delta (top 20, sorted by delta_velocity) ──
 rank    gene  delta_velocity  mean_velocity
    1    Rora        4.120846       3.732608
    2 Cacna1a        1.505980       1.126510
    3  Hs6st3        1.480293       1.539098
    4 Fam155a        1.426345       1.433674
    5   Kcnd2        1.362409       1.371242
    6   Asic2        1.297021       1.297021
    7   Park2        1.221469       1.468067
    8 Pip5k1b        1.090178       1.402752
    9  Ptprn2        1.041894       1.107937
   10   Abcc8        0.939510       0.964237
   11 Cacna1c        0.921160       0.950308
   12 Macrod2        0.901842       1.097218
   13    Ank2        0.719375       0.670792
   14   Kcnh8        0.636324       0.589051
   15  Kcnma1        0.628848       0.629416
   16 Phactr1        0.575674       0.518170
   17 Zcchc16        0.561209       0.582024
   18   Map1b        0.560959       0.566319
   19   Rims2        0.545161       0.666142
   20 Slc7a14        0.539349       0.539058

── Velocity drivers: Epsilon (top 20, sorted by delta_velocity) ──
 rank          gene  delta_velocity  mean_velocity
    1         Auts2        2.888110       3.241288
    2         Park2        1.922998       2.169597
    3       Fam155a        1.501959       1.509288
    4        Kcnma1        1.364251       1.364820
    5        Sphkap        1.008352       1.014405
    6         Mast4        0.923207       1.209805
    7       Zcchc16        0.891418       0.912233
    8         Rims2        0.864141       0.985122
    9 9030622O22Rik        0.845331       1.251969
   10         Cadps        0.767456       0.801107
   11        Hs6st3        0.742775       0.801580
   12         Gnao1        0.671777       0.664150
   13       Cacna1c        0.653965       0.683112
   14       Cacna1a        0.625256       0.245785
   15        Sorcs1        0.610847       0.627006
   16         Kcnb2        0.568632       0.640924
   17         Kcnd2        0.541085       0.549917
   18         Unc79        0.525438       0.484906
   19         Map1b        0.504821       0.510181
   20          Rfx6        0.480548       0.499856

── Velocity drivers: Alpha (top 20, sorted by delta_velocity) ──
 rank     gene  delta_velocity  mean_velocity
    1   Ptprn2        5.065232       4.972903
    2   Hs6st3        2.101268       2.160700
    3    Park2        1.049840       1.606843
    4  Fam155a        1.024209       1.038476
    5    Auts2        0.979488       1.735276
    6    Rims2        0.787453       0.852751
    7   Kcnma1        0.763136       0.760720
    8  Zcchc16        0.675566       0.695090
    9  Macrod2        0.602498       0.864472
   10    Kctd8        0.562066       0.548849
   11    Nlgn1        0.532786       0.552278
   12 Tmem178b        0.528826       0.529526
   13  Cacna1a        0.496395       0.321379
   14   Sorcs1        0.479955       0.494385
   15    Gnao1        0.449957       0.452301
   16    Unc79        0.443202       0.445140
   17    Glud1        0.359886       0.334689
   18    Ndst4        0.351433       0.358264
   19    Chrm3        0.326816       0.462213
   20   Kcnip4        0.319257       0.370047

── Velocity drivers: Beta (top 20, sorted by delta_velocity) ──
 rank    gene  delta_velocity  mean_velocity
    1    Ins2        9.558885      10.156736
    2  Ptprn2        3.255148       3.162819
    3    Rora        1.666505       1.843346
    4  Hs6st3        1.391292       1.450724
    5 Phactr1        0.967009       0.905735
    6   Sntg1        0.918031       1.298722
    7   Park2        0.891937       1.448940
    8    Nnat        0.832265       0.847311
    9 Fam155a        0.729469       0.743736
   10   Gnao1        0.685975       0.688319
   11 Macrod2        0.644620       0.906594
   12   Rims2        0.643239       0.708537
   13  Kcnmb2        0.473439       0.478471
   14   Unc5c        0.449677       0.458875
   15   Maml3        0.449581       0.691347
   16 Rapgef4        0.448530       0.488526
   17    Pax6        0.414843       0.411885
   18 Tmem108        0.408576       0.445672
   19   Abcc8        0.400374       0.416758
   20 Fam219a        0.323444       0.333184

── Velocity drivers: Delta (top 20, sorted by delta_velocity) ──
 rank     gene  delta_velocity  mean_velocity
    1   Hs6st3        2.254268       2.313700
    2     Rora        2.149730       2.326570
    3  Fam155a        1.761150       1.775418
    4  Macrod2        1.227703       1.489677
    5  Cacna1a        1.133342       0.958327
    6  Pip5k1b        0.948238       1.236933
    7    Abcc8        0.851071       0.867455
    8 Slc16a12        0.839184       0.930028
    9  Cacna1c        0.798074       0.800853
   10    Kcnd2        0.777342       0.791671
   11    Asic2        0.730172       0.732178
   12    Ptprt        0.713642       0.751418
   13    Map1b        0.630941       0.632863
   14   Gatsl2        0.561950       0.596788
   15    Tshz3        0.535825       0.543022
   16    Prkca        0.531170       0.610961
   17  Slc7a14        0.526877       0.528869
   18  Stxbp5l        0.511966       0.541099
   19     Ank2        0.473522       0.462186
   20    Kcnh8        0.466996       0.511684

── Velocity drivers: Epsilon (top 20, sorted by delta_velocity) ──
 rank          gene  delta_velocity  mean_velocity
    1        Ptprn2        2.387180       2.294851
    2 9030622O22Rik        1.907413       2.330741
    3       Cacna1c        1.846774       1.849553
    4        Sorcs1        1.739625       1.754055
    5       Fam155a        1.015867       1.030134
    6         Maml3        0.973382       1.215148
    7       Rapgef4        0.943933       0.983929
    8        Sphkap        0.866295       0.867441
    9        Hs6st3        0.820497       0.879930
   10         Park2        0.810861       1.367864
   11       Zcchc16        0.794487       0.814011
   12         Auts2        0.778251       1.534039
   13         Unc79        0.724618       0.726556
   14        Ctnna3        0.648964       0.663372
   15         Cadps        0.637715       0.652266
   16       Cacna1a        0.596067       0.421051
   17        Kcnma1        0.588465       0.586048
   18        Mamld1        0.576373       0.644715
   19         Rims2        0.551724       0.617022
   20        Rimbp2        0.526820       0.533911
Top velocity drivers (top 5 per fate, per condition):
[14]:
| condition | fate | gene | delta_velocity | mean_velocity | rank | |
|---|---|---|---|---|---|---|
| 0 | high_velocity | Alpha | Ptprn2 | 10.138916 | 10.179033 | 1 |
| 1 | high_velocity | Alpha | Hs6st3 | 3.034873 | 3.104659 | 2 |
| 2 | high_velocity | Alpha | Fam155a | 2.228252 | 2.250724 | 3 |
| 3 | high_velocity | Alpha | Rora | 1.744673 | 1.288695 | 4 |
| 4 | high_velocity | Alpha | Kcnma1 | 1.205779 | 1.199826 | 5 |
| ... | ... | ... | ... | ... | ... | ... |
| 55 | med_velocity | Epsilon | Ptprn2 | 2.387180 | 2.294851 | 1 |
| 56 | med_velocity | Epsilon | 9030622O22Rik | 1.907413 | 2.330741 | 2 |
| 57 | med_velocity | Epsilon | Cacna1c | 1.846774 | 1.849553 | 3 |
| 58 | med_velocity | Epsilon | Sorcs1 | 1.739625 | 1.754055 | 4 |
| 59 | med_velocity | Epsilon | Fam155a | 1.015867 | 1.030134 | 5 |
60 rows × 6 columns
[15]:
deg_drivers_per_cond = {}
for cond in mscorer.conditions:
    mask = (adata_sub_shared.obs[mscorer.condition_obs_key].astype(str) == cond).values
    sub = adata_sub_shared[mask].copy()
    deg_drivers_per_cond[cond] = get_deg_drivers(
        sub,
        fate_names=fate_names,
        obs_key=obs_key_used,
        root=root_cluster,
        n_top_genes=20,
        pval_threshold=0.05,
        logfc_threshold=0.25,
    )

# One compact table: (condition, fate, gene, logfoldchange, pval_adj, pct_*)
print("Top DEG drivers (top 5 per fate, per condition):")
_stack_drivers_by_condition(
    deg_drivers_per_cond,
    n_per_fate=5,
    cols=["gene", "logfoldchange", "pval_adj", "pct_fate", "pct_progenitor"],
)
── DEG drivers: Alpha vs progenitor ──
   Significant: 170  (up: 80, down: 90)
   gene  logfoldchange  pval_adj  pct_fate  pct_progenitor
   Iapp     165.372681  0.001959  1.000000             NaN
    Ttr     143.253738  0.001959  1.000000             NaN
    Pyy      99.835434  0.001959  1.000000             NaN
   Chgb      69.993912  0.001959  1.000000             NaN
   Gnas      59.068867  0.001959  1.000000             NaN
 Pcsk1n      47.226532  0.001959  1.000000             NaN
 Malat1      42.059872  0.007366  1.000000             NaN
 Tmem27      35.617493  0.001959  1.000000             NaN
 Sphkap      34.646255  0.009978  0.833333             NaN
  Rab37      31.131083  0.009978  0.833333             NaN
    Cpe      26.859491  0.001959  1.000000             NaN
   Chga      24.825945  0.001959  1.000000             NaN
   Rbp4      23.749779  0.001959  1.000000             NaN
   Bex2      17.820747  0.001959  1.000000             NaN
   Scg3      16.006983  0.009978  0.833333             NaN
Slc25a5      15.879355  0.001959  1.000000             NaN
  Pcsk2      15.673647  0.009978  0.833333             NaN
Fam183b      15.664439  0.001959  1.000000             NaN
  Aplp1      14.979936  0.001959  1.000000             NaN
Slc38a5      14.898108  0.009978  0.833333             NaN

── DEG drivers: Beta vs progenitor ──
   Significant: 1014  (up: 590, down: 424)
    gene  logfoldchange     pval_adj  pct_fate  pct_progenitor
    Iapp     319.308167 2.691527e-58  1.000000             NaN
    Ins1     231.821686 5.935833e-49  0.919643             NaN
     Pyy     176.222336 8.209008e-49  0.946429             NaN
    Ins2     114.226288 5.625770e-55  0.964286             NaN
    Nnat      80.990791 9.460143e-56  0.973214             NaN
    Gnas      60.395771 2.056687e-58  1.000000             NaN
    Rbp4      47.380043 3.605727e-57  0.991071             NaN
  Malat1      39.235798 2.014396e-35  1.000000             NaN
    Chgb      33.063000 2.056687e-58  1.000000             NaN
    Gng4      30.302731 9.661754e-17  0.517857             NaN
 Slc30a8      30.090532 3.339000e-13  0.455357             NaN
    Lrp8      29.957945 3.619816e-14  0.473214             NaN
Arhgap36      29.909950 3.719994e-08  0.348214             NaN
   Gnao1      29.817169 3.620658e-15  0.491071             NaN
  Sphkap      29.655596 9.837795e-13  0.446429             NaN
  Snap25      29.162764 3.719994e-08  0.348214             NaN
   Cntfr      28.942442 4.068914e-06  0.294643             NaN
     Ttr      28.782820 2.847681e-24  1.000000             NaN
   Nfasc      28.639511 5.877230e-05  0.258929             NaN
   Rab37      28.634060 4.068914e-06  0.294643             NaN

── DEG drivers: Epsilon vs progenitor ──
   Significant: 687  (up: 373, down: 314)
   gene  logfoldchange     pval_adj  pct_fate  pct_progenitor
   Ghrl     517.756226 1.204601e-21  1.000000             NaN
    Pyy      91.554626 2.922905e-07  0.702703             NaN
 Cdkn1a      73.212456 1.204601e-21  1.000000             NaN
    Cck      39.323284 5.578819e-21  0.972973             NaN
   Isl1      39.186619 1.204601e-21  1.000000             NaN
   Rbp4      38.788918 5.909970e-20  0.972973             NaN
 Lrpprc      35.442978 2.316388e-14  0.810811             NaN
   Gng4      32.237843 2.168506e-12  0.729730             NaN
   Dll3      30.021725 8.853757e-03  0.297297             NaN
  Gnao1      29.968044 1.761210e-05  0.459459             NaN
 Maged2      29.401833 5.480681e-18  0.972973             NaN
 Lrrtm3      29.124493 3.790129e-03  0.324324             NaN
   Sv2c      29.075603 8.853757e-03  0.297297             NaN
  Pex5l      28.918749 1.968029e-02  0.270270             NaN
  Ap1s2      28.487804 1.968029e-02  0.270270             NaN
Neurod1      28.314774 4.144581e-02  0.243243             NaN
 Malat1      27.702450 5.050441e-14  1.000000             NaN
Fam183b      19.508162 1.204601e-21  1.000000             NaN
    Ubb      17.677732 1.630272e-16  1.000000             NaN
Neurog3      17.597889 2.133376e-16  0.864865             NaN

── DEG drivers: Alpha vs progenitor ──
   Significant: 1038  (up: 622, down: 416)
    gene  logfoldchange     pval_adj  pct_fate  pct_progenitor
     Pyy     270.907867 1.095485e-61  0.972527             NaN
     Gcg     215.466476 5.573736e-28  0.681319             NaN
    Iapp      99.668839 7.016556e-44  0.846154             NaN
     Ttr      80.658424 1.391774e-61  1.000000             NaN
    Gnas      76.414871 5.342205e-66  1.000000             NaN
    Rbp4      55.058666 1.653055e-57  0.967033             NaN
  Malat1      50.032120 2.515452e-60  1.000000             NaN
    Isl1      42.396778 3.263752e-57  0.917582             NaN
   Pcsk2      39.577908 1.611496e-49  0.851648             NaN
    Irx2      32.601612 1.794797e-28  0.640110             NaN
    Chgb      32.077511 2.788463e-57  0.928571             NaN
  Sphkap      31.570948 3.814446e-34  0.703297             NaN
 Tmem163      30.995466 1.676530e-25  0.604396             NaN
   Ncam1      30.466309 4.006713e-19  0.519231             NaN
   Celf3      30.442444 1.090874e-21  0.554945             NaN
  Vwa5b2      30.106846 1.664818e-14  0.447802             NaN
  Cldn11      30.073782 1.500844e-10  0.376374             NaN
 Slc7a14      29.913431 7.425416e-14  0.436813             NaN
Pcsk2os1      29.691513 2.246793e-13  0.428571             NaN
   Pcsk1      29.630861 2.426720e-09  0.351648             NaN

── DEG drivers: Beta vs progenitor ──
   Significant: 1086  (up: 683, down: 403)
   gene  logfoldchange     pval_adj  pct_fate  pct_progenitor
    Pyy     184.695587 9.281464e-56  0.951952             NaN
   Iapp      97.912140 5.577822e-51  0.906907             NaN
   Gnas      71.186623 1.157115e-64  1.000000             NaN
   Rbp4      64.360428 5.196736e-64  0.996997             NaN
 Malat1      54.942646 5.491107e-61  1.000000             NaN
   Chgb      50.319710 1.168838e-63  0.987988             NaN
   Isl1      41.455986 9.597657e-60  0.951952             NaN
  Pcsk2      40.564831 6.367650e-63  0.978979             NaN
    Ttr      36.196297 3.638217e-49  0.993994             NaN
   Chga      34.888813 1.349103e-64  0.996997             NaN
Tmem163      31.561834 3.178231e-33  0.702703             NaN
  Pcsk1      31.447981 8.408603e-31  0.675676             NaN
    Gip      30.551739 3.254021e-03  0.183183             NaN
Gdap1l1      30.395351 4.760353e-22  0.567568             NaN
  Celf3      30.349344 3.622626e-23  0.582583             NaN
 Vwa5b2      30.107122 2.787453e-19  0.528529             NaN
 Cldn11      29.974279 6.003679e-12  0.408408             NaN
 Plcxd3      29.862917 5.027443e-15  0.462462             NaN
  Rab3b      29.845289 1.338192e-12  0.420420             NaN
  Ncam1      29.696566 8.602412e-12  0.405405             NaN

── DEG drivers: Delta vs progenitor ──
   Significant: 723  (up: 387, down: 336)
    gene  logfoldchange     pval_adj  pct_fate  pct_progenitor
     Pyy     560.111816 1.648064e-23      1.00             NaN
     Sst     337.905396 1.058007e-18      0.88             NaN
    Rbp4     216.754547 1.648064e-23      1.00             NaN
    Iapp     119.899414 1.788893e-23      1.00             NaN
  Malat1      65.846184 3.063520e-23      1.00             NaN
    Isl1      47.423279 1.648064e-23      1.00             NaN
    Gnas      41.713760 1.788893e-23      1.00             NaN
   Pcsk2      41.403732 3.230823e-22      0.96             NaN
    Frzb      30.745613 6.427865e-10      0.62             NaN
Ppp1r14c      30.685139 8.884320e-07      0.50             NaN
   Celf3      30.497181 2.939825e-07      0.52             NaN
   Rab3b      30.486515 9.601781e-08      0.54             NaN
   Kctd8      30.408361 2.597009e-06      0.48             NaN
     Ppy      30.359205 5.835742e-08      0.56             NaN
  Sez6l2      30.272020 8.884320e-07      0.50             NaN
  Fam92b      30.234203 3.057519e-08      0.56             NaN
 Gdap1l1      30.204899 9.601781e-08      0.54             NaN
   Pcsk1      30.201130 2.939825e-07      0.52             NaN
   Ncam1      30.071222 7.208312e-06      0.46             NaN
    St18      29.514408 2.811024e-04      0.38             NaN

── DEG drivers: Epsilon vs progenitor ──
   Significant: 848  (up: 493, down: 355)
    gene  logfoldchange     pval_adj  pct_fate  pct_progenitor
    Ghrl     498.352386 2.375788e-28  1.000000             NaN
     Pyy     128.112381 1.626203e-21  0.923077             NaN
    Rbp4     120.034706 2.375788e-28  1.000000             NaN
     Ttr      51.104588 6.265073e-21  1.000000             NaN
    Isl1      50.955517 8.561742e-28  0.984615             NaN
    Gnas      50.034081 5.945616e-28  1.000000             NaN
  Malat1      42.224209 5.564506e-25  1.000000             NaN
     Gcg      38.234589 2.171203e-07  0.553846             NaN
    Iapp      36.981209 2.233751e-23  0.923077             NaN
   Pcsk2      32.857044 8.084460e-13  0.646154             NaN
    Irx2      32.751572 5.533260e-14  0.676923             NaN
  Nap1l5      31.045471 3.560414e-10  0.569231             NaN
  Sphkap      30.900093 3.560414e-10  0.569231             NaN
 Gm43194      30.121216 5.042841e-07  0.461538             NaN
   Ncam1      30.119257 3.560414e-10  0.569231             NaN
Pcsk2os1      30.098072 7.509680e-08  0.492308             NaN
   Celf3      29.958424 3.560414e-10  0.569231             NaN
  Pou6f2      29.860731 7.749427e-05  0.369231             NaN
 Tmem163      29.805254 1.251068e-06  0.446154             NaN
 Gdap1l1      29.723566 7.122236e-06  0.415385             NaN

── DEG drivers: Alpha vs progenitor ──
   Significant: 934  (up: 497, down: 437)
    gene  logfoldchange     pval_adj  pct_fate  pct_progenitor
     Pyy     219.155823 2.833656e-45  0.954955             NaN
     Gcg     203.555252 7.818328e-14  0.576577             NaN
    Iapp     104.576691 4.358536e-37  0.873874             NaN
     Ttr      77.493851 8.624462e-45  1.000000             NaN
    Gnas      75.978882 1.650709e-51  1.000000             NaN
    Chgb      46.177563 7.129069e-43  0.909910             NaN
  Malat1      43.927719 4.928366e-39  1.000000             NaN
    Rbp4      42.754589 2.532834e-41  0.945946             NaN
BC048546      32.823662 8.888518e-33  0.783784             NaN
 Slc38a5      31.937300 2.120742e-43  0.909910             NaN
    Etv1      31.794817 8.486850e-23  0.648649             NaN
  Sphkap      31.697752 3.348922e-27  0.711712             NaN
   Gnao1      31.172338 9.190003e-19  0.585586             NaN
 Tmem163      31.162647 3.621997e-17  0.558559             NaN
 Slc30a8      30.911142 1.587695e-09  0.405405             NaN
    Rai2      30.712553 7.951286e-13  0.477477             NaN
   Cadps      30.268208 3.608526e-15  0.522523             NaN
 Gm43861      29.907495 1.958137e-08  0.378378             NaN
 Slc7a14      29.898027 3.749925e-09  0.396396             NaN
 Gdap1l1      29.892195 2.704527e-10  0.423423             NaN

── DEG drivers: Beta vs progenitor ──
   Significant: 1088  (up: 657, down: 431)
    gene  logfoldchange     pval_adj  pct_fate  pct_progenitor
    Iapp     291.223389 2.768662e-61  0.986301             NaN
     Pyy     196.978867 2.015121e-62  1.000000             NaN
    Ins1     185.555130 2.981718e-27  0.705479             NaN
    Ins2      77.237167 2.139489e-40  0.794521             NaN
    Nnat      70.255356 3.086069e-50  0.904110             NaN
    Gnas      64.764244 6.202128e-63  1.000000             NaN
    Rbp4      56.959015 6.202128e-63  1.000000             NaN
  Malat1      37.846973 4.326653e-44  1.000000             NaN
    Chgb      32.391380 1.631449e-61  0.986301             NaN
     Ttr      31.606613 9.026741e-38  0.993151             NaN
 Tmem163      31.063684 7.440471e-29  0.664384             NaN
   G6pc2      30.708227 6.214345e-22  0.575342             NaN
BC048546      30.439980 5.871768e-21  0.561644             NaN
 Slc30a8      30.429060 5.176797e-20  0.547945             NaN
Arhgap36      30.284391 4.239945e-09  0.356164             NaN
    Frzb      30.184422 5.057499e-16  0.486301             NaN
 Gdap1l1      30.173061 1.983171e-22  0.582192             NaN
   Gnao1      30.065212 9.701277e-18  0.513699             NaN
 Slc7a14      29.919584 1.935221e-16  0.493151             NaN
  Sphkap      29.781712 7.166407e-17  0.500000             NaN

── DEG drivers: Delta vs progenitor ──
   Significant: 479  (up: 210, down: 269)
    gene  logfoldchange     pval_adj  pct_fate  pct_progenitor
     Pyy     464.324585 1.610999e-10  1.000000             NaN
     Sst     338.118744 1.073547e-07  0.833333             NaN
    Rbp4     210.968674 1.610999e-10  1.000000             NaN
    Iapp      72.105080 1.949895e-09  0.944444             NaN
  Malat1      58.503399 1.071009e-09  1.000000             NaN
    Gnas      40.954994 1.610999e-10  1.000000             NaN
    Isl1      34.577591 1.610999e-10  1.000000             NaN
Ppp1r14c      32.689064 6.655484e-08  0.833333             NaN
    Frzb      31.795914 4.198904e-06  0.722222             NaN
    Rai2      31.174133 1.386014e-04  0.611111             NaN
   Gnao1      31.094294 1.386014e-04  0.611111             NaN
    St18      30.554657 1.386014e-04  0.611111             NaN
BC048546      30.449245 2.682706e-02  0.388889             NaN
 Gdap1l1      30.255129 8.792385e-03  0.444444             NaN
  Kcnmb2      30.096973 8.792385e-03  0.444444             NaN
   Scn3a      30.061802 6.245587e-04  0.555556             NaN
    Etv1      29.126734 2.682706e-02  0.388889             NaN
    Hhex      21.994329 9.207233e-10  1.000000             NaN
 Fam183b      19.523029 1.610999e-10  1.000000             NaN
     Ubb      19.173141 2.719530e-07  1.000000             NaN

── DEG drivers: Epsilon vs progenitor ──
   Significant: 783  (up: 422, down: 361)
    gene  logfoldchange     pval_adj  pct_fate  pct_progenitor
    Ghrl     485.379456 2.998483e-22     1.000             NaN
     Pyy     163.205170 3.450739e-19     0.950             NaN
    Rbp4      99.282028 2.998483e-22     1.000             NaN
  Lrpprc      56.673809 3.247204e-18     0.900             NaN
    Isl1      47.636112 2.998483e-22     1.000             NaN
  Malat1      46.982475 8.548388e-19     1.000             NaN
  Mboat4      33.095497 1.517948e-12     0.725             NaN
   Gnao1      32.037502 9.017539e-12     0.700             NaN
    Etv1      30.398169 6.235255e-06     0.475             NaN
  Nap1l5      30.321486 4.682076e-07     0.525             NaN
    St18      30.176975 4.682076e-07     0.525             NaN
Ppp1r14c      30.062613 2.013902e-05     0.450             NaN
 Tmem163      29.851349 4.848064e-04     0.375             NaN
 Gm43861      29.556721 2.013902e-05     0.450             NaN
   Cadps      29.550922 2.013902e-05     0.450             NaN
BC048546      29.533049 2.946907e-03     0.325             NaN
  Pou6f2      29.491068 1.392431e-02     0.275             NaN
Serping1      29.471628 2.013902e-05     0.450             NaN
    Rai2      29.452677 1.392431e-02     0.275             NaN
   Gria2      29.375956 4.848064e-04     0.375             NaN
Top DEG drivers (top 5 per fate, per condition):
[15]:
| condition | fate | gene | logfoldchange | pval_adj | pct_fate | pct_progenitor | |
|---|---|---|---|---|---|---|---|
| 0 | high_velocity | Alpha | Iapp | 165.372681 | 1.959313e-03 | 1.00 | NaN |
| 1 | high_velocity | Alpha | Ttr | 143.253738 | 1.959313e-03 | 1.00 | NaN |
| 2 | high_velocity | Alpha | Pyy | 99.835434 | 1.959313e-03 | 1.00 | NaN |
| 3 | high_velocity | Alpha | Chgb | 69.993912 | 1.959313e-03 | 1.00 | NaN |
| 4 | high_velocity | Alpha | Gnas | 59.068867 | 1.959313e-03 | 1.00 | NaN |
| ... | ... | ... | ... | ... | ... | ... | ... |
| 50 | med_velocity | Epsilon | Ghrl | 485.379456 | 2.998483e-22 | 1.00 | NaN |
| 51 | med_velocity | Epsilon | Pyy | 163.205170 | 3.450739e-19 | 0.95 | NaN |
| 52 | med_velocity | Epsilon | Rbp4 | 99.282028 | 2.998483e-22 | 1.00 | NaN |
| 53 | med_velocity | Epsilon | Lrpprc | 56.673809 | 3.247204e-18 | 0.90 | NaN |
| 54 | med_velocity | Epsilon | Isl1 | 47.636112 | 2.998483e-22 | 1.00 | NaN |
55 rows × 7 columns
[16]:
# Driver overlap across all 3 conditions:
# rows = (fate, gene); columns = condition presence + n_conds + shared_all flag.
overlap = _driver_overlap(deg_drivers_per_cond, n_top=10, gene_col="gene")

# Cross-tab: how many genes are shared by exactly k conditions, per fate?
overlap.groupby(["fate", "n_conds"]).size().unstack(fill_value=0)
[16]:
| n_conds | 1 | 2 | 3 |
|---|---|---|---|
| fate | |||
| Alpha | 9 | 3 | 5 |
| Beta | 4 | 4 | 6 |
| Epsilon | 12 | 3 | 4 |
[17]:
# Show the genes that are condition-specific (n_conds == 1) for each fate.
specific = overlap[overlap["n_conds"] == 1]
specific.head(30)
[17]:
| fate | gene | high_velocity | low_velocity | med_velocity | n_conds | shared_all | |
|---|---|---|---|---|---|---|---|
| 0 | Alpha | BC048546 | False | False | True | 1 | False |
| 3 | Alpha | Gnao1 | True | False | False | 1 | False |
| 6 | Alpha | Irx2 | False | True | False | 1 | False |
| 7 | Alpha | Isl1 | False | True | False | 1 | False |
| 9 | Alpha | Pcsk1n | True | False | False | 1 | False |
| 10 | Alpha | Pcsk2 | False | True | False | 1 | False |
| 13 | Alpha | Slc38a5 | False | False | True | 1 | False |
| 14 | Alpha | Sphkap | True | False | False | 1 | False |
| 15 | Alpha | Tmem27 | True | False | False | 1 | False |
| 17 | Beta | Chga | False | True | False | 1 | False |
| 20 | Beta | Gng4 | True | False | False | 1 | False |
| 24 | Beta | Isl1 | False | True | False | 1 | False |
| 27 | Beta | Pcsk2 | False | True | False | 1 | False |
| 31 | Epsilon | Cck | True | False | False | 1 | False |
| 32 | Epsilon | Cdkn1a | True | False | False | 1 | False |
| 33 | Epsilon | Dll3 | True | False | False | 1 | False |
| 34 | Epsilon | Etv1 | False | False | True | 1 | False |
| 35 | Epsilon | Gcg | False | True | False | 1 | False |
| 38 | Epsilon | Gnas | False | True | False | 1 | False |
| 39 | Epsilon | Gng4 | True | False | False | 1 | False |
| 40 | Epsilon | Iapp | False | True | False | 1 | False |
| 44 | Epsilon | Mboat4 | False | False | True | 1 | False |
| 45 | Epsilon | Nap1l5 | False | False | True | 1 | False |
| 46 | Epsilon | Pcsk2 | False | True | False | 1 | False |
| 49 | Epsilon | Ttr | False | True | False | 1 | False |
11. Pathway enrichment per condition¶
We run run_enrichment_per_fate on the per-condition DEG drivers (offline-safe: wrapped in try/except). The compact _stack_enrichment_by_condition helper builds one tidy table with columns (condition, fate, direction, Term, Adjusted P-value, Overlap, ...).
The cell will be empty in published HTML if
gseapycannot reach Enrichr (no internet during doc build). Run interactively for live results.
[18]:
enrichment_per_cond = {}
try:
    for cond in mscorer.conditions:
        enrichment_per_cond[cond] = run_enrichment_per_fate(
            deg_drivers_per_cond[cond],
            fate_names=fate_names,
            organism="mouse",
            pval_threshold=0.05,
            logfc_threshold=0.25,
            plot=False,
            n_top_pathways=10,
        )
    display(_stack_enrichment_by_condition(enrichment_per_cond, n_per_group=3))
except Exception as e:
    print(f"Enrichment skipped (offline?): {e}")
============================================================
Pathway enrichment: Alpha
Gene sets: ['KEGG_2019_Mouse', 'GO_Biological_Process_2021', 'Reactome_2022']
Up-regulated genes : 80
Down-regulated genes: 90
============================================================
[up] Significant terms: 1
Gene_set Term Overlap Adjusted P-value
KEGG_2019_Mouse Thyroid hormone synthesis 4/73 0.026393
[down] Significant terms: 107
Gene_set Term Overlap Adjusted P-value
GO_Biological_Process_2021 SRP-dependent cotranslational protein targeting to membrane (GO:0006614) 25/90 4.833486e-36
GO_Biological_Process_2021 cytoplasmic translation (GO:0002181) 25/93 5.612907e-36
GO_Biological_Process_2021 cotranslational protein targeting to membrane (GO:0006613) 25/94 5.612907e-36
GO_Biological_Process_2021 protein targeting to ER (GO:0045047) 25/103 5.632949e-35
GO_Biological_Process_2021 nuclear-transcribed mRNA catabolic process, nonsense-mediated decay (GO:0000184) 25/113 6.008108e-34
Reactome_2022 Eukaryotic Translation Elongation R-HSA-156842 23/90 6.362739e-33
Reactome_2022 Selenocysteine Synthesis R-HSA-2408557 23/90 6.362739e-33
Reactome_2022 Viral mRNA Translation R-HSA-192823 23/90 6.362739e-33
Reactome_2022 Peptide Chain Elongation R-HSA-156902 23/86 6.362739e-33
Reactome_2022 Eukaryotic Translation Termination R-HSA-72764 23/90 6.362739e-33
============================================================
Pathway enrichment: Beta
Gene sets: ['KEGG_2019_Mouse', 'GO_Biological_Process_2021', 'Reactome_2022']
Up-regulated genes : 590
Down-regulated genes: 424
============================================================
[up] Significant terms: 208
Gene_set Term Overlap Adjusted P-value
KEGG_2019_Mouse Protein processing in endoplasmic reticulum 27/163 7.997215e-11
GO_Biological_Process_2021 regulation of insulin secretion (GO:0050796) 20/104 6.403333e-08
KEGG_2019_Mouse Maturity onset diabetes of the young 10/27 3.115636e-07
KEGG_2019_Mouse Insulin secretion 16/86 3.212812e-07
GO_Biological_Process_2021 IRE1-mediated unfolded protein response (GO:0036498) 14/53 3.765361e-07
Reactome_2022 Regulation Of Insulin Secretion R-HSA-422356 16/77 7.171901e-07
Reactome_2022 Integration Of Energy Metabolism R-HSA-163685 18/105 8.433568e-07
Reactome_2022 Peptide Hormone Metabolism R-HSA-2980736 16/89 2.224553e-06
Reactome_2022 IRE1alpha Activates Chaperones R-HSA-381070 12/48 2.650485e-06
GO_Biological_Process_2021 regulation of peptide hormone secretion (GO:0090276) 15/74 3.172567e-06
[down] Significant terms: 397
Gene_set Term Overlap Adjusted P-value
GO_Biological_Process_2021 cotranslational protein targeting to membrane (GO:0006613) 31/94 2.277097e-25
GO_Biological_Process_2021 SRP-dependent cotranslational protein targeting to membrane (GO:0006614) 30/90 6.161288e-25
GO_Biological_Process_2021 cytoplasmic translation (GO:0002181) 30/93 1.266777e-24
GO_Biological_Process_2021 cellular macromolecule biosynthetic process (GO:0034645) 48/314 1.805540e-24
GO_Biological_Process_2021 protein targeting to ER (GO:0045047) 30/103 2.379529e-23
Reactome_2022 Peptide Chain Elongation R-HSA-156902 28/86 5.980082e-23
Reactome_2022 Eukaryotic Translation Elongation R-HSA-156842 28/90 1.267632e-22
GO_Biological_Process_2021 nuclear-transcribed mRNA catabolic process, nonsense-mediated decay (GO:0000184) 30/113 4.173200e-22
Reactome_2022 Viral mRNA Translation R-HSA-192823 27/90 9.255427e-22
Reactome_2022 Eukaryotic Translation Termination R-HSA-72764 27/90 9.255427e-22
============================================================
Pathway enrichment: Epsilon
Gene sets: ['KEGG_2019_Mouse', 'GO_Biological_Process_2021', 'Reactome_2022']
Up-regulated genes : 373
Down-regulated genes: 314
============================================================
[up] Significant terms: 86
Gene_set Term Overlap Adjusted P-value
GO_Biological_Process_2021 positive regulation of insulin secretion (GO:0032024) 10/38 0.000003
KEGG_2019_Mouse Maturity onset diabetes of the young 8/27 0.000005
KEGG_2019_Mouse Protein processing in endoplasmic reticulum 15/163 0.000050
GO_Biological_Process_2021 regulation of insulin secretion (GO:0050796) 13/104 0.000085
GO_Biological_Process_2021 cellular response to insulin stimulus (GO:0032869) 14/129 0.000108
KEGG_2019_Mouse Lysosome 12/124 0.000285
Reactome_2022 Peptide Hormone Metabolism R-HSA-2980736 11/89 0.000615
Reactome_2022 Regulation Of Gene Expression In Beta Cells R-HSA-210745 6/20 0.000615
GO_Biological_Process_2021 positive regulation of peptide hormone secretion (GO:0090277) 8/43 0.000668
KEGG_2019_Mouse Synaptic vesicle cycle 9/77 0.000772
[down] Significant terms: 336
Gene_set Term Overlap Adjusted P-value
GO_Biological_Process_2021 cotranslational protein targeting to membrane (GO:0006613) 31/94 1.597058e-29
GO_Biological_Process_2021 SRP-dependent cotranslational protein targeting to membrane (GO:0006614) 30/90 5.896162e-29
GO_Biological_Process_2021 cytoplasmic translation (GO:0002181) 30/93 1.232166e-28
GO_Biological_Process_2021 protein targeting to ER (GO:0045047) 30/103 3.054501e-27
Reactome_2022 Peptide Chain Elongation R-HSA-156902 28/86 1.170006e-26
Reactome_2022 Eukaryotic Translation Elongation R-HSA-156842 28/90 2.534405e-26
GO_Biological_Process_2021 cellular macromolecule biosynthetic process (GO:0034645) 44/314 2.536834e-26
GO_Biological_Process_2021 nuclear-transcribed mRNA catabolic process, nonsense-mediated decay (GO:0000184) 30/113 4.524592e-26
Reactome_2022 Eukaryotic Translation Termination R-HSA-72764 27/90 3.086957e-25
Reactome_2022 Selenocysteine Synthesis R-HSA-2408557 27/90 3.086957e-25
============================================================
Pathway enrichment: Alpha
Gene sets: ['KEGG_2019_Mouse', 'GO_Biological_Process_2021', 'Reactome_2022']
Up-regulated genes : 622
Down-regulated genes: 416
============================================================
[up] Significant terms: 156
Gene_set Term Overlap Adjusted P-value
GO_Biological_Process_2021 regulation of insulin secretion (GO:0050796) 22/104 2.445585e-09
KEGG_2019_Mouse Lysosome 21/124 6.084043e-08
Reactome_2022 Regulation Of Insulin Secretion R-HSA-422356 17/77 1.756719e-07
Reactome_2022 Integration Of Energy Metabolism R-HSA-163685 19/105 2.811906e-07
GO_Biological_Process_2021 positive regulation of insulin secretion (GO:0032024) 12/38 1.367715e-06
Reactome_2022 Peptide Hormone Metabolism R-HSA-2980736 16/89 4.795716e-06
KEGG_2019_Mouse Dopaminergic synapse 19/135 5.062926e-06
GO_Biological_Process_2021 regulation of peptide hormone secretion (GO:0090276) 15/74 6.661253e-06
Reactome_2022 G-protein Mediated Events R-HSA-112040 12/52 1.289888e-05
Reactome_2022 Opioid Signaling R-HSA-111885 15/88 1.713559e-05
[down] Significant terms: 444
Gene_set Term Overlap Adjusted P-value
GO_Biological_Process_2021 cellular macromolecule biosynthetic process (GO:0034645) 52/314 2.873895e-28
GO_Biological_Process_2021 cytoplasmic translation (GO:0002181) 31/93 4.126134e-26
GO_Biological_Process_2021 cotranslational protein targeting to membrane (GO:0006613) 31/94 4.126134e-26
Reactome_2022 Cell Cycle R-HSA-1640170 68/654 1.190819e-25
Reactome_2022 Cell Cycle, Mitotic R-HSA-69278 61/523 1.190819e-25
GO_Biological_Process_2021 SRP-dependent cotranslational protein targeting to membrane (GO:0006614) 30/90 1.707288e-25
Reactome_2022 Peptide Chain Elongation R-HSA-156902 28/86 1.181197e-23
GO_Biological_Process_2021 protein targeting to ER (GO:0045047) 30/103 1.233512e-23
GO_Biological_Process_2021 nuclear-transcribed mRNA catabolic process, nonsense-mediated decay (GO:0000184) 31/113 1.233512e-23
Reactome_2022 Eukaryotic Translation Elongation R-HSA-156842 28/90 2.507804e-23
============================================================
Pathway enrichment: Beta
Gene sets: ['KEGG_2019_Mouse', 'GO_Biological_Process_2021', 'Reactome_2022']
Up-regulated genes : 683
Down-regulated genes: 403
============================================================
[up] Significant terms: 129
Gene_set Term Overlap Adjusted P-value
KEGG_2019_Mouse Maturity onset diabetes of the young 13/27 2.565614e-10
GO_Biological_Process_2021 regulation of insulin secretion (GO:0050796) 22/104 1.618268e-08
GO_Biological_Process_2021 regulation of peptide hormone secretion (GO:0090276) 16/74 4.589452e-06
KEGG_2019_Mouse Protein processing in endoplasmic reticulum 22/163 5.130451e-06
GO_Biological_Process_2021 neuron projection morphogenesis (GO:0048812) 21/140 1.223028e-05
KEGG_2019_Mouse Lysosome 18/124 1.923302e-05
GO_Biological_Process_2021 positive regulation of insulin secretion (GO:0032024) 11/38 2.647650e-05
Reactome_2022 Regulation Of Insulin Secretion R-HSA-422356 15/77 4.590873e-05
Reactome_2022 Integration Of Energy Metabolism R-HSA-163685 17/105 5.146225e-05
GO_Biological_Process_2021 neuron projection development (GO:0031175) 22/171 5.680492e-05
[down] Significant terms: 422
Gene_set Term Overlap Adjusted P-value
GO_Biological_Process_2021 cellular macromolecule biosynthetic process (GO:0034645) 50/314 6.593606e-27
GO_Biological_Process_2021 cytoplasmic translation (GO:0002181) 31/93 1.544213e-26
GO_Biological_Process_2021 SRP-dependent cotranslational protein targeting to membrane (GO:0006614) 30/90 8.594398e-26
GO_Biological_Process_2021 cotranslational protein targeting to membrane (GO:0006613) 30/94 2.875876e-25
Reactome_2022 Cell Cycle, Mitotic R-HSA-69278 60/523 2.890128e-25
Reactome_2022 Cell Cycle R-HSA-1640170 65/654 2.708074e-24
GO_Biological_Process_2021 nuclear-transcribed mRNA catabolic process, nonsense-mediated decay (GO:0000184) 31/113 4.564548e-24
GO_Biological_Process_2021 protein targeting to ER (GO:0045047) 30/103 4.564548e-24
Reactome_2022 Peptide Chain Elongation R-HSA-156902 28/86 4.816521e-24
Reactome_2022 Eukaryotic Translation Termination R-HSA-72764 28/90 1.230265e-23
============================================================
Pathway enrichment: Delta
Gene sets: ['KEGG_2019_Mouse', 'GO_Biological_Process_2021', 'Reactome_2022']
Up-regulated genes : 387
Down-regulated genes: 336
============================================================
[up] Significant terms: 125
Gene_set Term Overlap Adjusted P-value
GO_Biological_Process_2021 positive regulation of peptide hormone secretion (GO:0090277) 9/43 0.000122
GO_Biological_Process_2021 regulation of insulin secretion (GO:0050796) 13/104 0.000122
KEGG_2019_Mouse Lysosome 13/124 0.000200
KEGG_2019_Mouse Dopaminergic synapse 13/135 0.000210
KEGG_2019_Mouse Circadian entrainment 11/99 0.000210
KEGG_2019_Mouse Protein processing in endoplasmic reticulum 14/163 0.000210
GO_Biological_Process_2021 positive regulation of insulin secretion (GO:0032024) 8/38 0.000400
KEGG_2019_Mouse Maturity onset diabetes of the young 6/27 0.000492
KEGG_2019_Mouse cAMP signaling pathway 15/211 0.000636
KEGG_2019_Mouse Long-term potentiation 8/67 0.001459
[down] Significant terms: 448
Gene_set Term Overlap Adjusted P-value
GO_Biological_Process_2021 cellular macromolecule biosynthetic process (GO:0034645) 50/314 8.751611e-31
GO_Biological_Process_2021 cytoplasmic translation (GO:0002181) 31/93 4.906936e-29
GO_Biological_Process_2021 cotranslational protein targeting to membrane (GO:0006613) 31/94 4.906936e-29
GO_Biological_Process_2021 SRP-dependent cotranslational protein targeting to membrane (GO:0006614) 30/90 2.530390e-28
GO_Biological_Process_2021 protein targeting to ER (GO:0045047) 30/103 1.723374e-26
GO_Biological_Process_2021 nuclear-transcribed mRNA catabolic process, nonsense-mediated decay (GO:0000184) 31/113 1.723374e-26
Reactome_2022 Peptide Chain Elongation R-HSA-156902 28/86 8.381928e-26
Reactome_2022 Eukaryotic Translation Elongation R-HSA-156842 28/90 1.205212e-25
Reactome_2022 Eukaryotic Translation Termination R-HSA-72764 28/90 1.205212e-25
Reactome_2022 Nonsense Mediated Decay (NMD) Independent Of Exon Junction Complex (EJC) R-HSA-975956 28/92 1.821364e-25
============================================================
Pathway enrichment: Epsilon
Gene sets: ['KEGG_2019_Mouse', 'GO_Biological_Process_2021', 'Reactome_2022']
Up-regulated genes : 493
Down-regulated genes: 355
============================================================
[up] Significant terms: 87
Gene_set Term Overlap Adjusted P-value
KEGG_2019_Mouse Lysosome 19/124 4.820439e-08
Reactome_2022 Peptide Hormone Metabolism R-HSA-2980736 16/89 4.651280e-07
Reactome_2022 Regulation Of Insulin Secretion R-HSA-422356 13/77 2.184121e-05
Reactome_2022 Integration Of Energy Metabolism R-HSA-163685 14/105 9.460261e-05
Reactome_2022 Incretin Synthesis, Secretion, And Inactivation R-HSA-400508 7/24 3.011596e-04
KEGG_2019_Mouse Protein processing in endoplasmic reticulum 16/163 3.382496e-04
Reactome_2022 G-protein Mediated Events R-HSA-112040 9/52 8.465563e-04
Reactome_2022 Hemostasis R-HSA-109582 33/576 1.113725e-03
Reactome_2022 Synthesis, Secretion, And Inactivation Of Glucagon-like Peptide-1 (GLP-1) R-HSA-381771 6/21 1.151083e-03
Reactome_2022 Synthesis, Secretion, And Inactivation Of Glucose-dependent Insulinotropic Polypeptide (GIP) R-HSA-400511 5/13 1.151083e-03
[down] Significant terms: 469
Gene_set Term Overlap Adjusted P-value
GO_Biological_Process_2021 cellular macromolecule biosynthetic process (GO:0034645) 50/314 1.342079e-29
GO_Biological_Process_2021 cytoplasmic translation (GO:0002181) 31/93 2.855442e-28
GO_Biological_Process_2021 SRP-dependent cotranslational protein targeting to membrane (GO:0006614) 30/90 1.815036e-27
GO_Biological_Process_2021 cotranslational protein targeting to membrane (GO:0006613) 30/94 6.131343e-27
GO_Biological_Process_2021 nuclear-transcribed mRNA catabolic process, nonsense-mediated decay (GO:0000184) 31/113 9.159060e-26
GO_Biological_Process_2021 protein targeting to ER (GO:0045047) 30/103 9.159060e-26
Reactome_2022 Peptide Chain Elongation R-HSA-156902 28/86 4.034992e-25
Reactome_2022 Eukaryotic Translation Elongation R-HSA-156842 28/90 5.780159e-25
Reactome_2022 Eukaryotic Translation Termination R-HSA-72764 28/90 5.780159e-25
Reactome_2022 Nonsense Mediated Decay (NMD) Independent Of Exon Junction Complex (EJC) R-HSA-975956 28/92 8.718902e-25
============================================================
Pathway enrichment: Alpha
Gene sets: ['KEGG_2019_Mouse', 'GO_Biological_Process_2021', 'Reactome_2022']
Up-regulated genes : 497
Down-regulated genes: 437
============================================================
[up] Significant terms: 141
Gene_set Term Overlap Adjusted P-value
GO_Biological_Process_2021 regulation of insulin secretion (GO:0050796) 19/104 2.499845e-08
Reactome_2022 Integration Of Energy Metabolism R-HSA-163685 18/105 5.126029e-08
Reactome_2022 Regulation Of Insulin Secretion R-HSA-422356 16/77 5.126029e-08
Reactome_2022 Peptide Hormone Metabolism R-HSA-2980736 15/89 1.587271e-06
GO_Biological_Process_2021 regulation of peptide hormone secretion (GO:0090276) 14/74 4.221168e-06
KEGG_2019_Mouse Dopaminergic synapse 17/135 1.054884e-05
GO_Biological_Process_2021 positive regulation of insulin secretion (GO:0032024) 10/38 1.757779e-05
KEGG_2019_Mouse Lysosome 15/124 5.576827e-05
KEGG_2019_Mouse Synaptic vesicle cycle 11/77 2.462138e-04
GO_Biological_Process_2021 regulation of protein secretion (GO:0050708) 15/125 3.236405e-04
[down] Significant terms: 476
Gene_set Term Overlap Adjusted P-value
Reactome_2022 Cell Cycle, Mitotic R-HSA-69278 65/523 1.514502e-27
Reactome_2022 Cell Cycle R-HSA-1640170 70/654 4.031318e-26
GO_Biological_Process_2021 cytoplasmic translation (GO:0002181) 31/93 1.940433e-25
GO_Biological_Process_2021 cellular macromolecule biosynthetic process (GO:0034645) 50/314 1.940433e-25
GO_Biological_Process_2021 cotranslational protein targeting to membrane (GO:0006613) 31/94 1.940433e-25
GO_Biological_Process_2021 SRP-dependent cotranslational protein targeting to membrane (GO:0006614) 30/90 7.639023e-25
Reactome_2022 Peptide Chain Elongation R-HSA-156902 28/86 4.680497e-23
GO_Biological_Process_2021 nuclear-transcribed mRNA catabolic process, nonsense-mediated decay (GO:0000184) 31/113 5.687463e-23
GO_Biological_Process_2021 protein targeting to ER (GO:0045047) 30/103 5.687463e-23
Reactome_2022 Viral mRNA Translation R-HSA-192823 28/90 9.896098e-23
============================================================
Pathway enrichment: Beta
Gene sets: ['KEGG_2019_Mouse', 'GO_Biological_Process_2021', 'Reactome_2022']
Up-regulated genes : 657
Down-regulated genes: 431
============================================================
[up] Significant terms: 137
Gene_set Term Overlap Adjusted P-value
GO_Biological_Process_2021 regulation of insulin secretion (GO:0050796) 24/104 9.438360e-11
KEGG_2019_Mouse Protein processing in endoplasmic reticulum 27/163 1.008634e-09
KEGG_2019_Mouse Maturity onset diabetes of the young 12/27 2.024887e-09
GO_Biological_Process_2021 regulation of peptide hormone secretion (GO:0090276) 18/74 2.995445e-08
Reactome_2022 Regulation Of Insulin Secretion R-HSA-422356 18/77 4.483648e-08
Reactome_2022 Integration Of Energy Metabolism R-HSA-163685 20/105 9.876732e-08
KEGG_2019_Mouse Lysosome 20/124 3.369271e-07
GO_Biological_Process_2021 IRE1-mediated unfolded protein response (GO:0036498) 14/53 1.061323e-06
KEGG_2019_Mouse Insulin secretion 16/86 1.119385e-06
GO_Biological_Process_2021 regulation of protein secretion (GO:0050708) 20/125 3.321822e-06
[down] Significant terms: 476
Gene_set Term Overlap Adjusted P-value
Reactome_2022 Cell Cycle, Mitotic R-HSA-69278 64/523 4.941445e-27
GO_Biological_Process_2021 cellular macromolecule biosynthetic process (GO:0034645) 51/314 1.748442e-26
Reactome_2022 Cell Cycle R-HSA-1640170 69/654 1.072989e-25
GO_Biological_Process_2021 cytoplasmic translation (GO:0002181) 31/93 1.271360e-25
GO_Biological_Process_2021 cotranslational protein targeting to membrane (GO:0006613) 31/94 1.271360e-25
GO_Biological_Process_2021 SRP-dependent cotranslational protein targeting to membrane (GO:0006614) 30/90 5.075307e-25
Reactome_2022 Peptide Chain Elongation R-HSA-156902 28/86 3.238070e-23
GO_Biological_Process_2021 nuclear-transcribed mRNA catabolic process, nonsense-mediated decay (GO:0000184) 31/113 3.747490e-23
GO_Biological_Process_2021 protein targeting to ER (GO:0045047) 30/103 3.747490e-23
Reactome_2022 Eukaryotic Translation Termination R-HSA-72764 28/90 8.225337e-23
============================================================
Pathway enrichment: Delta
Gene sets: ['KEGG_2019_Mouse', 'GO_Biological_Process_2021', 'Reactome_2022']
Up-regulated genes : 210
Down-regulated genes: 269
============================================================
[up] Significant terms: 72
Gene_set Term Overlap Adjusted P-value
KEGG_2019_Mouse Maturity onset diabetes of the young 5/27 0.001473
Reactome_2022 Peptide Hormone Metabolism R-HSA-2980736 8/89 0.002027
Reactome_2022 GPER1 Signaling R-HSA-9634597 6/43 0.002027
GO_Biological_Process_2021 positive regulation of insulin secretion (GO:0032024) 6/38 0.002066
GO_Biological_Process_2021 regulation of insulin secretion (GO:0050796) 9/104 0.002066
Reactome_2022 Regulation Of Insulin Secretion R-HSA-422356 7/77 0.003584
Reactome_2022 Glucagon Signaling In Metabolic Regulation R-HSA-163359 5/32 0.003584
KEGG_2019_Mouse GABAergic synapse 7/90 0.004117
KEGG_2019_Mouse Circadian entrainment 7/99 0.005051
Reactome_2022 Anti-inflammatory Response Favoring Leishmania Infection R-HSA-9662851 9/165 0.005561
[down] Significant terms: 389
Gene_set Term Overlap Adjusted P-value
GO_Biological_Process_2021 cytoplasmic translation (GO:0002181) 31/93 7.807101e-32
GO_Biological_Process_2021 SRP-dependent cotranslational protein targeting to membrane (GO:0006614) 30/90 5.017236e-31
GO_Biological_Process_2021 cotranslational protein targeting to membrane (GO:0006613) 30/94 1.532275e-30
GO_Biological_Process_2021 nuclear-transcribed mRNA catabolic process, nonsense-mediated decay (GO:0000184) 31/113 1.975454e-29
GO_Biological_Process_2021 protein targeting to ER (GO:0045047) 30/103 2.140043e-29
Reactome_2022 Peptide Chain Elongation R-HSA-156902 28/86 1.334897e-28
Reactome_2022 Eukaryotic Translation Elongation R-HSA-156842 28/90 1.944818e-28
Reactome_2022 Eukaryotic Translation Termination R-HSA-72764 28/90 1.944818e-28
Reactome_2022 Nonsense Mediated Decay (NMD) Independent Of Exon Junction Complex (EJC) R-HSA-975956 28/92 2.958477e-28
Reactome_2022 Selenocysteine Synthesis R-HSA-2408557 27/90 3.518813e-27
============================================================
Pathway enrichment: Epsilon
Gene sets: ['KEGG_2019_Mouse', 'GO_Biological_Process_2021', 'Reactome_2022']
Up-regulated genes : 422
Down-regulated genes: 361
============================================================
[up] Significant terms: 94
Gene_set Term Overlap Adjusted P-value
Reactome_2022 Peptide Hormone Metabolism R-HSA-2980736 14/89 0.000005
KEGG_2019_Mouse Lysosome 14/124 0.000044
KEGG_2019_Mouse Protein processing in endoplasmic reticulum 16/163 0.000044
KEGG_2019_Mouse Dopaminergic synapse 13/135 0.000450
KEGG_2019_Mouse GABAergic synapse 10/90 0.001159
KEGG_2019_Mouse Phagosome 14/180 0.001186
KEGG_2019_Mouse Long-term depression 8/61 0.001186
KEGG_2019_Mouse Synaptic vesicle cycle 9/77 0.001186
KEGG_2019_Mouse Circadian entrainment 10/99 0.001186
KEGG_2019_Mouse cAMP signaling pathway 15/211 0.001186
[down] Significant terms: 433
Gene_set Term Overlap Adjusted P-value
GO_Biological_Process_2021 cotranslational protein targeting to membrane (GO:0006613) 31/94 6.997589e-28
GO_Biological_Process_2021 cytoplasmic translation (GO:0002181) 31/93 6.997589e-28
GO_Biological_Process_2021 SRP-dependent cotranslational protein targeting to membrane (GO:0006614) 30/90 2.976495e-27
GO_Biological_Process_2021 cellular macromolecule biosynthetic process (GO:0034645) 47/314 1.126661e-26
GO_Biological_Process_2021 protein targeting to ER (GO:0045047) 30/103 1.496237e-25
GO_Biological_Process_2021 nuclear-transcribed mRNA catabolic process, nonsense-mediated decay (GO:0000184) 31/113 1.496237e-25
Reactome_2022 Peptide Chain Elongation R-HSA-156902 28/86 6.336531e-25
Reactome_2022 Eukaryotic Translation Termination R-HSA-72764 28/90 6.799818e-25
Reactome_2022 Eukaryotic Translation Elongation R-HSA-156842 28/90 6.799818e-25
Reactome_2022 Cell Cycle, Mitotic R-HSA-69278 56/523 6.799818e-25
| condition | fate | direction | Gene_set | Term | Overlap | P-value | Adjusted P-value | Old P-value | Old Adjusted P-value | Odds Ratio | Combined Score | Genes | |
|---|---|---|---|---|---|---|---|---|---|---|---|---|---|
| 0 | high_velocity | Alpha | up | KEGG_2019_Mouse | Thyroid hormone synthesis | 4/73 | 2.094671e-04 | 2.639285e-02 | 0 | 0 | 15.141876 | 128.265986 | TTR;GPX3;GNAS;PDIA4 |
| 1 | high_velocity | Alpha | down | GO_Biological_Process_2021 | SRP-dependent cotranslational protein targetin... | 25/90 | 5.142006e-39 | 4.833486e-36 | 0 | 0 | 117.426036 | 10352.675635 | RPL3;RPL32;RPLP1;RPL12;RPLP0;RPL10A;RPL7;RPS4X... |
| 2 | high_velocity | Alpha | down | GO_Biological_Process_2021 | cytoplasmic translation (GO:0002181) | 25/93 | 1.319036e-38 | 5.612907e-36 | 0 | 0 | 112.228507 | 9788.719925 | RPL3;RPL32;RPLP1;RPL12;RPLP0;RPL10A;RPL7;RPS4X... |
| 3 | high_velocity | Alpha | down | GO_Biological_Process_2021 | cotranslational protein targeting to membrane ... | 25/94 | 1.791353e-38 | 5.612907e-36 | 0 | 0 | 110.596433 | 9612.517927 | RPL3;RPL32;RPLP1;RPL12;RPLP0;RPL10A;RPL7;RPS4X... |
| 4 | high_velocity | Beta | up | KEGG_2019_Mouse | Protein processing in endoplasmic reticulum | 27/163 | 3.186142e-13 | 7.997215e-11 | 0 | 0 | 6.796547 | 195.569247 | ERO1LB;RPN2;TUSC3;HSPA4L;RPN1;SEL1L;RRBP1;RNF5... |
| ... | ... | ... | ... | ... | ... | ... | ... | ... | ... | ... | ... | ... | ... |
| 59 | med_velocity | Epsilon | up | KEGG_2019_Mouse | Lysosome | 14/124 | 3.691181e-07 | 4.410919e-05 | 0 | 0 | 6.072906 | 89.952783 | CD164;CD63;ATP6V0B;ATP6AP1;CTSZ;HEXA;CLTB;CTSO... |
| 60 | med_velocity | Epsilon | up | KEGG_2019_Mouse | Protein processing in endoplasmic reticulum | 16/163 | 3.802516e-07 | 4.410919e-05 | 0 | 0 | 5.209209 | 77.004778 | HSPA8;RPN2;HSPA5;TUSC3;SSR2;HSPA4L;RPN1;EDEM2;... |
| 61 | med_velocity | Epsilon | down | GO_Biological_Process_2021 | cotranslational protein targeting to membrane ... | 31/94 | 5.836188e-31 | 6.997589e-28 | 0 | 0 | 29.189803 | 2032.079063 | RPL3;ARL6IP1;RPL32;RPL10;RPLP1;RPL12;RPLP0;RPL... |
| 62 | med_velocity | Epsilon | down | GO_Biological_Process_2021 | cytoplasmic translation (GO:0002181) | 31/93 | 3.975154e-31 | 6.997589e-28 | 0 | 0 | 29.662121 | 2076.350692 | RPL3;RPL32;RPL10;RPLP1;RPL12;RPLP0;RPL11;RPL10... |
| 63 | med_velocity | Epsilon | down | GO_Biological_Process_2021 | SRP-dependent cotranslational protein targetin... | 30/90 | 3.723722e-30 | 2.976495e-27 | 0 | 0 | 29.575529 | 2004.121493 | RPL3;RPL32;RPL10;RPLP1;RPL12;RPLP0;RPL11;RPL10... |
64 rows × 13 columns
12. Expression trends along fate arms — per condition¶
plot_expression_trends shows how marker genes evolve along each fate arm. Running it once per condition on the masked adata_sub puts the per-condition curves side by side, so you can spot timing shifts, magnitude changes, or qualitatively different trajectories.
We use x_axis="affinity" here — distance along each fate arm in the shared embedding. "pseudotime" and "radial_distance" are also supported.
[19]:
from dataclasses import replace

genes = ["Ins1", "Gcg"]  # Beta-cell + Alpha-cell markers
genes = [g for g in genes if g in adata_sub_shared.var_names]

# Use cell_obs_names from each per-condition result to mask the shared
# CommitmentScoreResult to that condition (plot_expression_trends expects
# a result whose cell_obs_names index into the passed AnnData).
cell_names_full = np.array(adata_sub_shared.obs_names)
for cond in mscorer.conditions:
    mask = (adata_sub_shared.obs[mscorer.condition_obs_key].astype(str) == cond).values
    res_full = results[cond]
    if res_full.cell_scores is None:
        print(f"\n--- {cond}: no cell-level scores; rerun score_all_conditions(cell_level=True). Skipping. ---")
        continue
    # Some results store full-shape arrays (one per shared-embedding cell)
    # while others store only this-condition cells; handle both.
    if res_full.cell_scores.shape[0] == adata_sub_shared.n_obs:
        cs = res_full.cell_scores[mask]
        cnames = cell_names_full[mask]
        nne = res_full.nn_cell_entropy[mask] if res_full.nn_cell_entropy is not None else None
    else:
        cs = res_full.cell_scores
        cnames = np.asarray(res_full.cell_obs_names)
        nne = res_full.nn_cell_entropy
    res_masked = replace(
        res_full,
        cell_scores=cs,
        cell_obs_names=cnames,
        nn_cell_entropy=nne,
    )
    print(f"\n--- {cond} (n={cs.shape[0]} cells) ---")
    try:
        fig = plot_expression_trends(
            adata_sub_shared,
            res_masked,
            genes=genes,
            x_axis="affinity",
            figsize=(12, 4),
        )
        plt.suptitle(f"Expression trends — {cond}", y=1.02)
        plt.show()
    except Exception as e:
        print(f"Expression trends failed for {cond}: {e}")
--- high_velocity (n=633 cells) ---
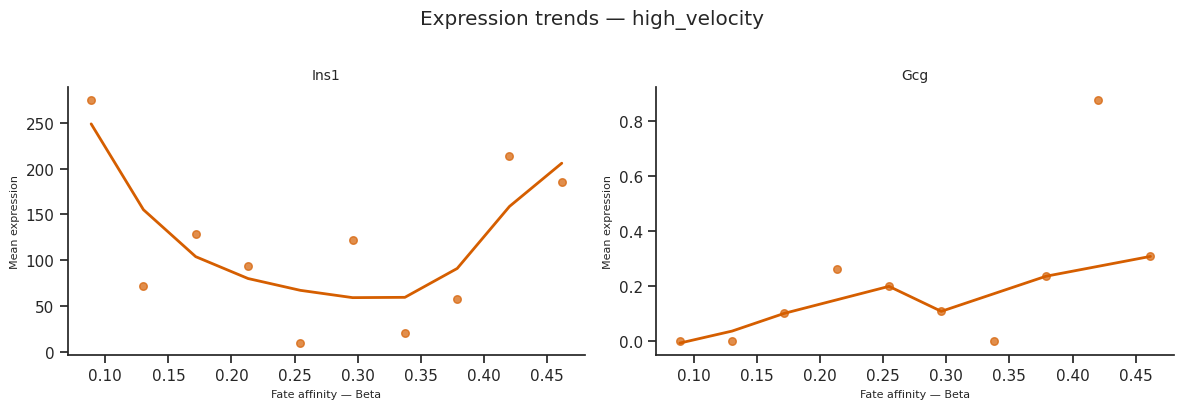
--- low_velocity (n=957 cells) ---
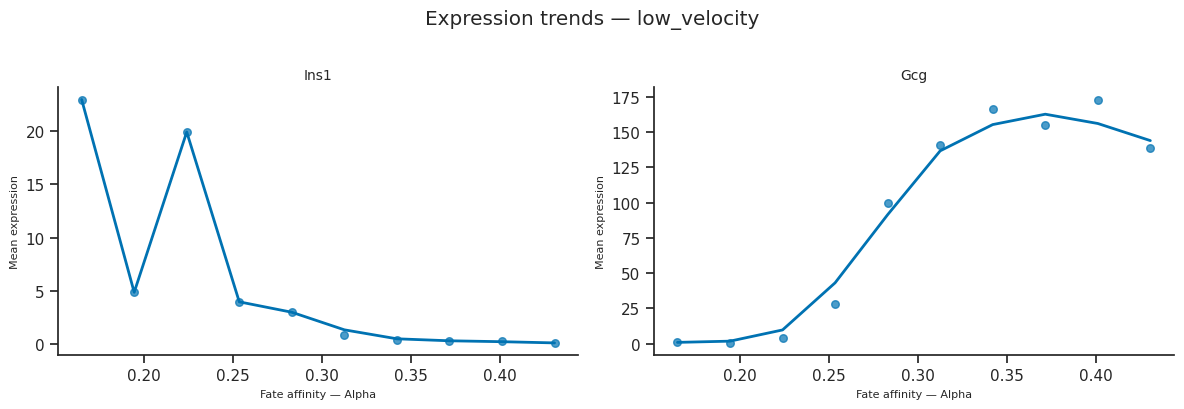
--- med_velocity (n=610 cells) ---
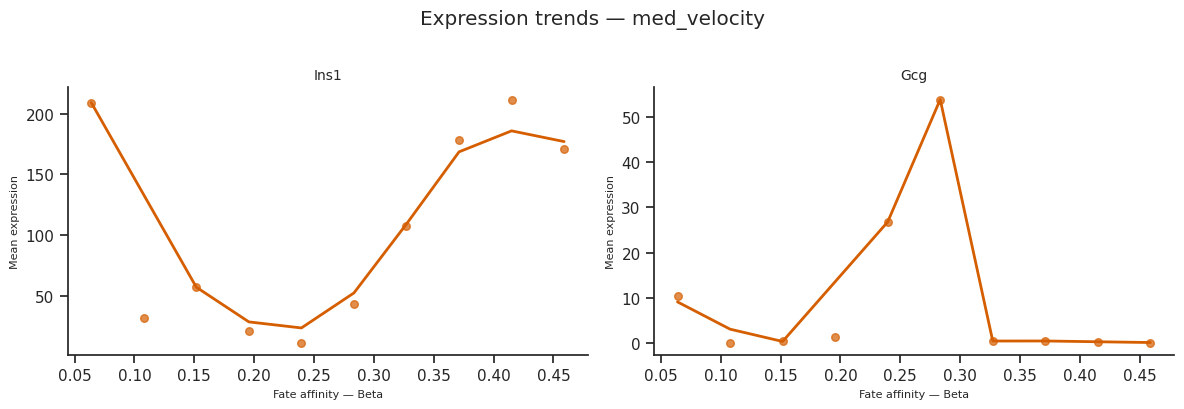
13. Transfer per-cell labels back to the full AnnData¶
transfer_labels writes per-cell, per-condition affinity scores and dominant fate labels back to the FULL adata as new obs columns (named cs_{fate}_{condition} and cs_dominant_fate_{condition}). This lets you use the scCS outputs in downstream Scanpy / scVelo workflows — UMAP coloring, marker discovery, etc.
[20]:
# MultiScorer.transfer_labels writes cs_{condition}_{...} columns to
# mscorer.adata internally — no positional adata argument needed.
mscorer.transfer_labels(results, prefix="cs_")

new_cols = [c for c in mscorer.adata.obs.columns
            if c.startswith("cs_") and any(cond in c for cond in mscorer.conditions)]
print(f"New columns written to adata.obs ({len(new_cols)}):")
for c in new_cols[:15]:
    print(f"  - {c}")
if len(new_cols) > 15:
    print(f"  ... +{len(new_cols) - 15} more")
[scCS] Labels transferred to adata.obs for 2200 / 3696 cells. Columns: ['cs_high_velocity_Alpha', 'cs_high_velocity_Beta', 'cs_high_velocity_Delta', 'cs_high_velocity_Epsilon', 'cs_high_velocity_dominant_fate', 'cs_high_velocity_entropy']
[scCS] Labels transferred to adata.obs for 2200 / 3696 cells. Columns: ['cs_low_velocity_Alpha', 'cs_low_velocity_Beta', 'cs_low_velocity_Delta', 'cs_low_velocity_Epsilon', 'cs_low_velocity_dominant_fate', 'cs_low_velocity_entropy']
[scCS] Labels transferred to adata.obs for 2200 / 3696 cells. Columns: ['cs_med_velocity_Alpha', 'cs_med_velocity_Beta', 'cs_med_velocity_Delta', 'cs_med_velocity_Epsilon', 'cs_med_velocity_dominant_fate', 'cs_med_velocity_entropy']
New columns written to adata.obs (18):
  - cs_high_velocity_Alpha
  - cs_high_velocity_Beta
  - cs_high_velocity_Delta
  - cs_high_velocity_Epsilon
  - cs_high_velocity_dominant_fate
  - cs_high_velocity_entropy
  - cs_low_velocity_Alpha
  - cs_low_velocity_Beta
  - cs_low_velocity_Delta
  - cs_low_velocity_Epsilon
  - cs_low_velocity_dominant_fate
  - cs_low_velocity_entropy
  - cs_med_velocity_Alpha
  - cs_med_velocity_Beta
  - cs_med_velocity_Delta
  ... +3 more
[21]:
# Quick UMAP showing dominant fate per condition (if UMAP is available).
# transfer_labels wrote columns to mscorer.adata, so plot from there.
full = mscorer.adata
if "X_umap" not in full.obsm:
    sc.pp.neighbors(full, n_neighbors=15) if "distances" not in full.obsp else None
    sc.tl.umap(full)

dom_cols = [c for c in full.obs.columns if c.startswith("cs_dominant_fate_")]
if dom_cols:
    sc.pl.umap(full, color=dom_cols, ncols=len(mscorer.conditions),
               wspace=0.4, show=True)
else:
    print("No cs_dominant_fate_* columns found in mscorer.adata.obs — "
          "make sure transfer_labels() ran successfully above.")
No cs_dominant_fate_* columns found in mscorer.adata.obs — make sure transfer_labels() ran successfully above.
14. Summary — scCS 3+ condition workflow¶
import scCS

# 1. Add condition column (3+ levels) to adata.obs
adata.obs["condition"] = ...     # e.g., 'control', 'drug_A', 'drug_B'
adata.obs["sample"]    = ...     # biological replicates

# 2. Initialize MultiScorer
mscorer = scCS.MultiScorer(
    adata,
    root="Ductal",
    branches=["Alpha", "Beta", "Delta", "Epsilon"],
    condition_obs_key="condition",
    obs_key="clusters",
)

# 3. Build SHARED embedding on pooled data, then fit
mscorer.build_embedding(ordering_metric="velocity_pseudotime")
mscorer.fit()
# (optional) mscorer.refit_pseudotime() — only call when the subset has
# a connected velocity_graph; otherwise stick with velocity_pseudotime.

# ── Tier 1 — score each condition ────────────────────────────────────────────
results = mscorer.score_all_conditions(cell_level=True, n_bootstrap=200)

# ── Tier 2 — omnibus + post-hoc ──────────────────────────────────────────────
omnibus_df = mscorer.compare_omnibus(results, test="kruskal")
posthoc_df = mscorer.compare_posthoc(
    results, omnibus_results=omnibus_df, method="dunn",
    pval_correction="bonferroni", pval_threshold=0.05,
)
deltas     = mscorer.compute_pairwise_deltas(n_bootstrap=100)

# ── Tier 3 — mixed model with reference contrasts ────────────────────────────
contrasts_df = mscorer.fit_mixed_model_contrasts(
    results, ref_condition="control", replicate_key="sample"
)

# ── Visualizations ───────────────────────────────────────────────────────────
mscorer.plot_omnibus_summary(omnibus_df, results, posthoc_df=posthoc_df)
mscorer.plot_posthoc_heatmap(posthoc_df)
mscorer.plot_pairwise_delta_grid(deltas)
mscorer.plot_star_grid(results)
mscorer.plot_rose_grid(results)

# ── Downstream §10 — driver genes per condition ──────────────────────────────
# Loop conditions: mask adata_sub per condition -> get_velocity_drivers /
# get_deg_drivers -> _stack_drivers_by_condition -> one tidy table.

# ── Downstream §11 — pathway enrichment per condition ────────────────────────
# Loop conditions: run_enrichment_per_fate on each cond's DEG drivers ->
# _stack_enrichment_by_condition -> one tidy table.

# ── Downstream §12 — expression trends per condition ─────────────────────────
# Loop conditions: build a per-condition CommitmentScoreResult via
# dataclasses.replace, masking cell_scores/cell_obs_names/nn_cell_entropy
# to that condition's cells, then plot_expression_trends.

# ── Downstream §13 — transfer labels back to mscorer.adata ───────────────────
mscorer.transfer_labels(results, prefix="cs_")
# Writes cs_{condition}_{fate} + cs_{condition}_dominant_fate + cs_{condition}_entropy
Interpretation guide¶
Result |
Interpretation |
|---|---|
Omnibus q < 0.05 for a fate |
Affinity for that fate differs across at least one condition pair |
Post-hoc q < 0.05 for (a, b) |
That specific condition pair drives the difference |
ΔnCS CI excludes 0 |
Pairwise commitment shift is significant |
Mixed-model contrast coef significant |
Condition effect on affinity, controlling for replicate |
Top driver gene in only 1 condition |
Condition-specific regulator candidate |
Pathway enriched in only 1 condition |
Differentially activated pathway |
Expression curve shifted in 1 condition |
Altered developmental timing for that gene |
For 2-condition comparisons see Pairwise Comparison Analysis.ipynb; for single-condition analysis see Single Condition Analysis.ipynb.